Niet-lineaire logistische regressie
In hoofdstuk 3 heb je gekeken naar de afstand die forenzen aflegden en het lineaire effect daarvan op de kans dat iemand met de bus gaat. Maar wat als deze relatie niet-lineair en niet-monotoon is?
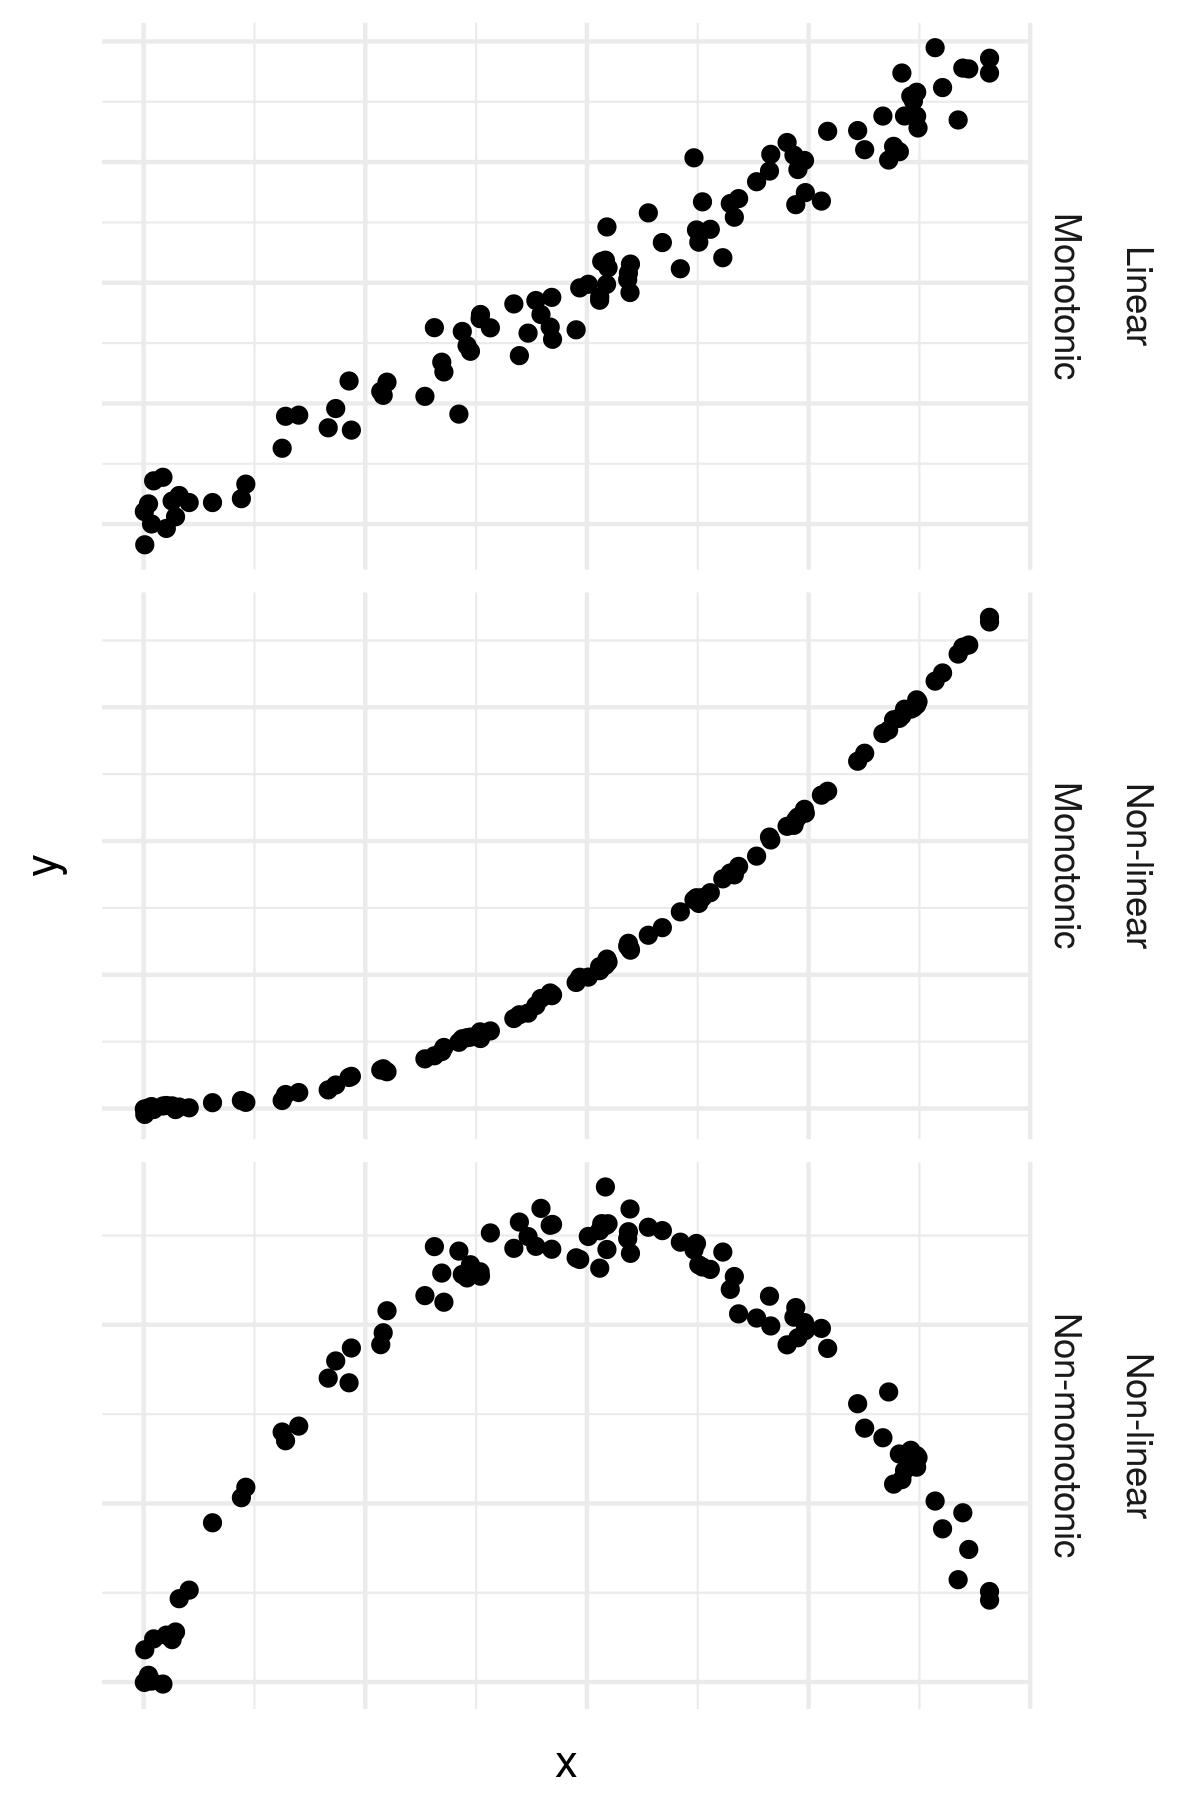
Wat als bijvoorbeeld mensen die de kortste én de langste afstanden reizen, minder vaak met de bus gaan?
Je kunt niet-lineaire termen toevoegen aan formules in R met de functie I(..) als onderdeel van je formule.
Bijvoorbeeld, y~I(x^2) laat je een coëfficiënt schatten voor x*x.
In deze oefening ga je dieper in op de busgegevens.
Deze oefening maakt deel uit van de cursus
Generalized Linear Models in R
Oefeninstructies
- Voeg de formule
y ~ I(x^2)toe aan de optieformulain de tweede aanroep vangeom_smooth().
Interactieve oefening met praktijkervaring
Probeer deze oefening door deze voorbeeldcode aan te vullen.
# Plot linear effect of travel distance on probability of taking the bus
gg_jitter <-
	ggplot(data = bus, aes(x = MilesOneWay, y = Bus2)) +
	geom_jitter(width = 0, height = 0.05) +
	geom_smooth(method = 'glm',
                method.args = list(family = 'binomial'))

# Add a non-linear equation to a geom_smooth()
gg_jitter +
	geom_smooth(method = 'glm',
                method.args = list(family = 'binomial'),
                formula = ___,
                color = 'red')