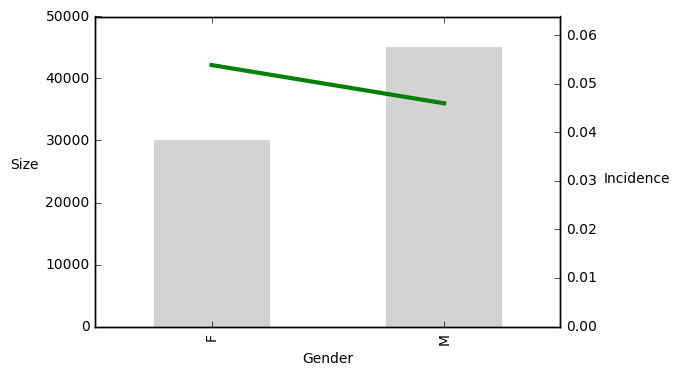
Interpretasi grafik wawasan prediktor
Pertimbangkan grafik wawasan prediktor yang menunjukkan hubungan antara insidensi target dan jenis kelamin (M - laki-laki, F - perempuan) dari calon donor. Batang menunjukkan ukuran kelompok, garis menunjukkan persentase target.
Latihan ini merupakan bagian dari kursus
Pengantar Predictive Analytics dengan Python
Latihan interaktif langsung
Ubah teori menjadi aksi dengan salah satu latihan interaktif kami
 Mulai latihan