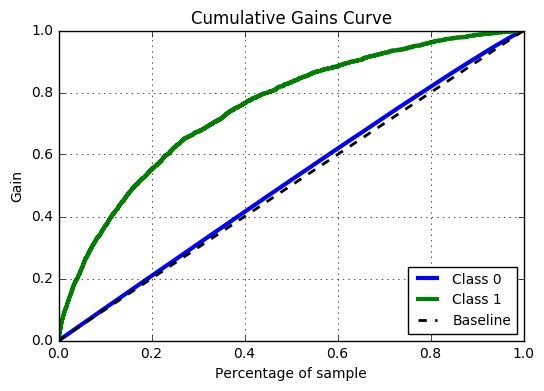
Menafsirkan kurva cumulative gains
Anda membangun model untuk memprediksi donor mana yang paling mungkin merespons sebuah kampanye dan membuat kurva cumulative gains seperti di bawah ini. Asumsikan Anda memiliki anggaran untuk mengirim surat kepada 30 000 donor teratas dari total 100 000 donor. Berapa banyak target (donor yang merespons) yang akan Anda jangkau, jika ada 5 000 target dari 100 000 donor? Ingat bahwa kurva cumulative gains menunjukkan, untuk setiap nilai x pada sumbu horizontal, persentase target yang tercapai ketika menggunakan model.
Latihan ini merupakan bagian dari kursus
Pengantar Predictive Analytics dengan Python
Latihan interaktif langsung
Ubah teori menjadi aksi dengan salah satu latihan interaktif kami
 Mulai latihan