Calculer des métriques à partir de la matrice de confusion
La matrice de confusion d’un modèle de classification binaire récapitule le nombre de prédictions correctes et incorrectes obtenues sur l’ensemble de test et permet d’évaluer les performances de votre modèle.
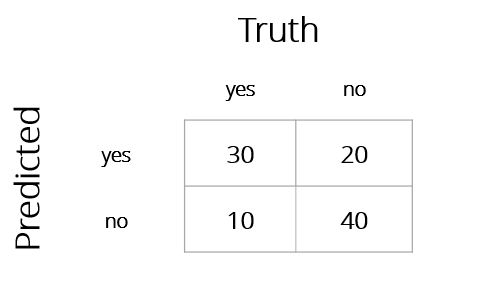
Supposons que vous ayez entraîné un modèle de classification qui prédit si des clients vont résilier leur service auprès d’un opérateur télécom et que vous obteniez la matrice de confusion suivante sur votre ensemble de test. Ici, yes représente la classe positive, tandis que no représente la classe négative.
Choisissez l’affirmation vraie parmi les options ci-dessous.
Cet exercice fait partie du cours
<cours>Modéliser avec tidymodels en R</cours>Exercice interactif pratique
Transformez la théorie en action avec l’un de nos exercices interactifs
 Commencer l’exercice