Échelle-position
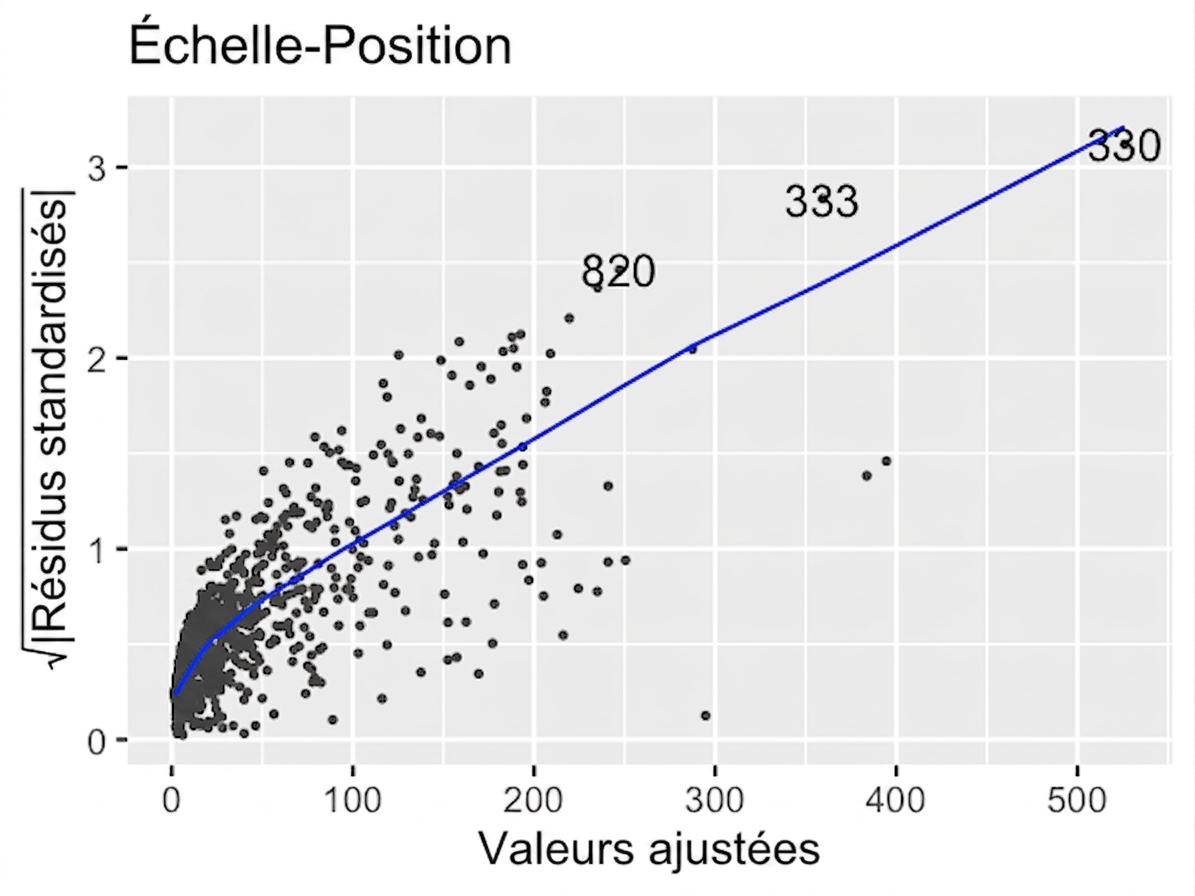
Voici les graphiques normaux d’échelle-position des deux modèles précédents. En d'autres termes, ils indiquent la taille des résidus par rapport aux valeurs ajustées.
Modèle original (n_clicks par rapport à n_impressions)
Modèle transformé (n_clicks ^ 0.25 par opposition à n_impressions ^ 0.25)
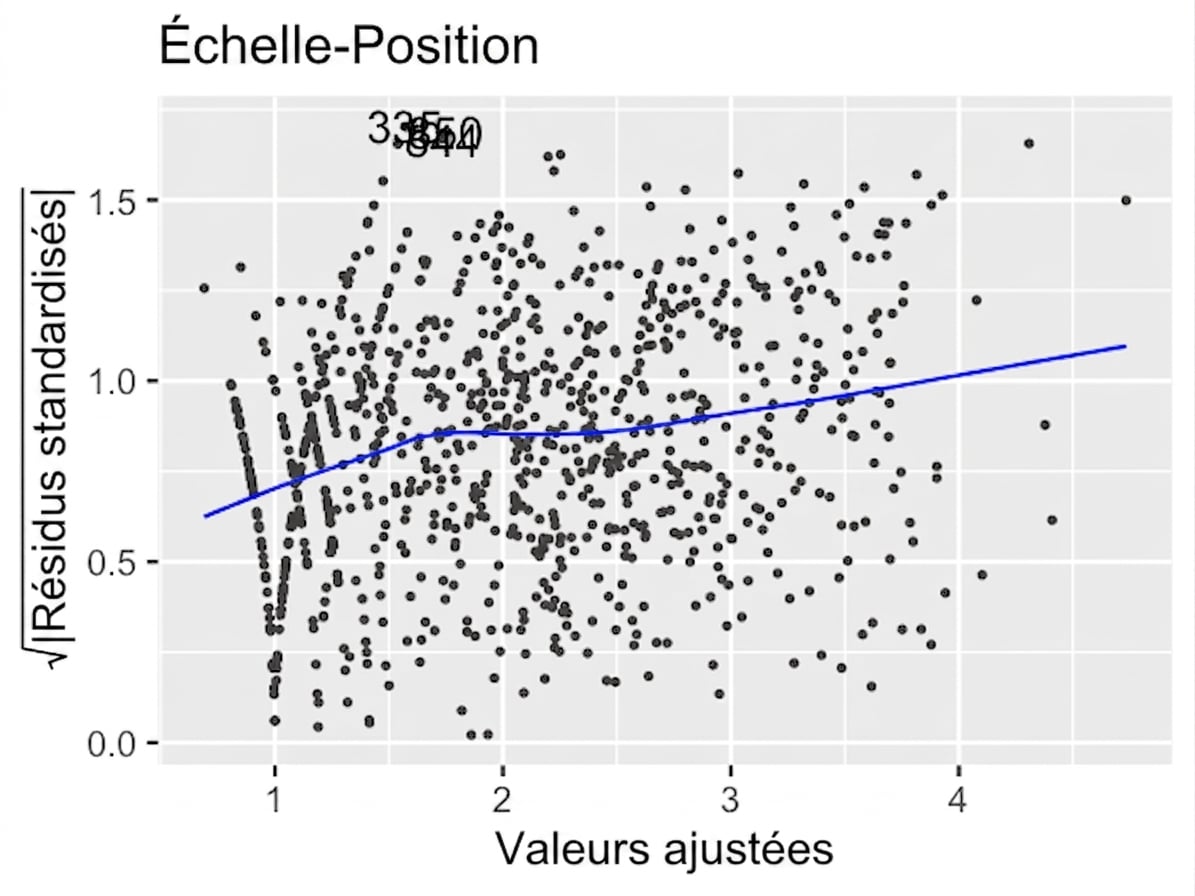
Veuillez examiner les valeurs sur l'axe des y et la pente de la courbe de tendance. Quelle affirmation est vraie ?
Cet exercice fait partie du cours
<cours>Introduction à la régression dans R</cours>Exercice interactif pratique
Transformez la théorie en action avec l’un de nos exercices interactifs
 Commencer l’exercice