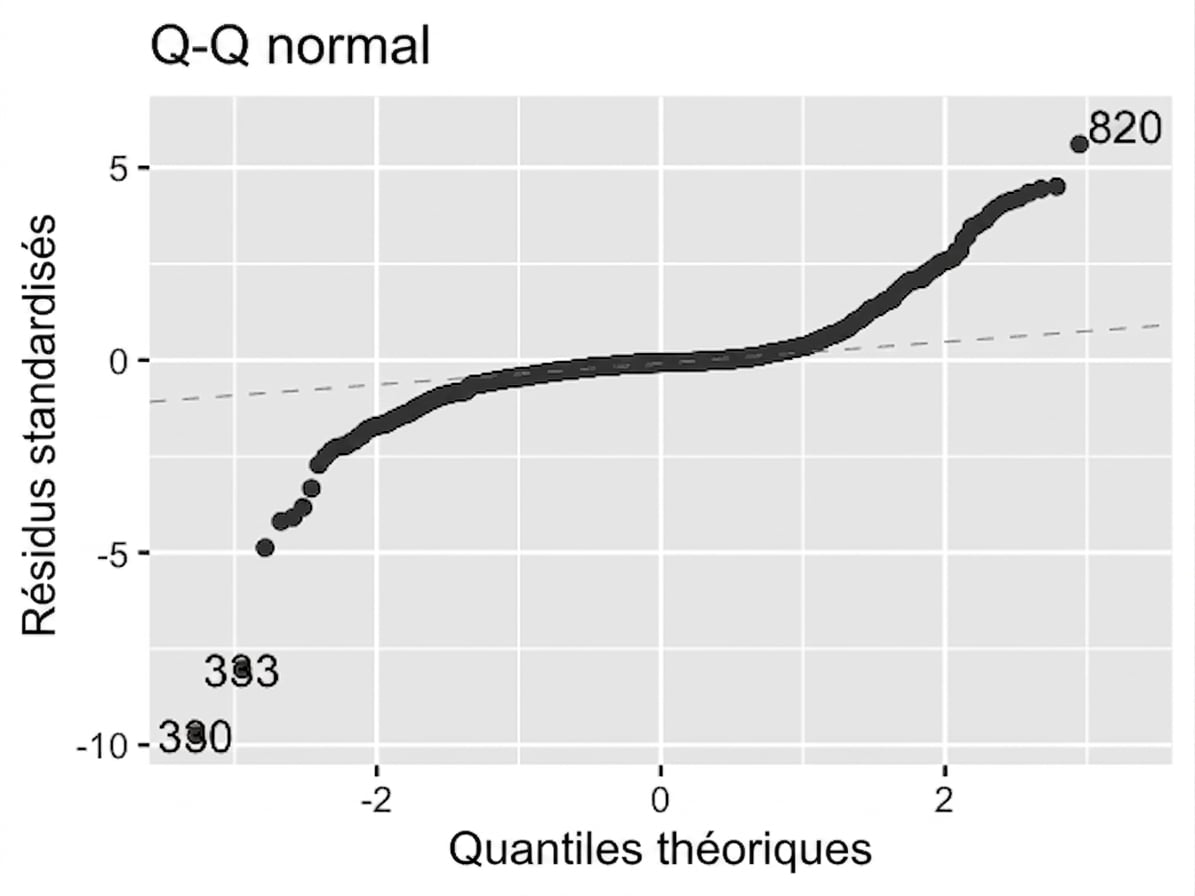
Graphique Q-Q des résidus
Voici les graphiques Q-Q normaux des deux modèles précédents.
Modèle original (n_clicks par rapport à n_impressions)
Modèle transformé (n_clicks ^ 0.25 par opposition à n_impressions ^ 0.25)
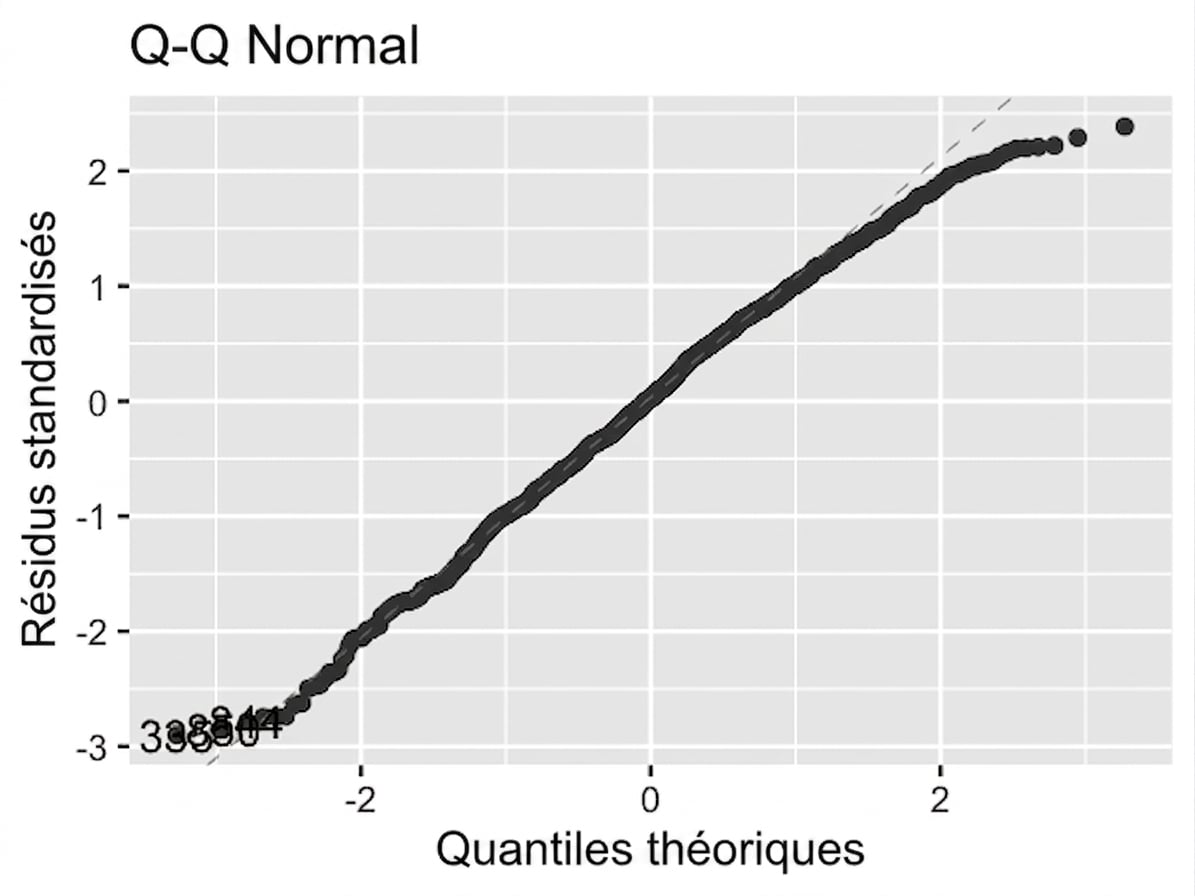
Veuillez observer à quel point les points suivent la ligne de « normalité ». Quelle affirmation est vraie ?
Cet exercice fait partie du cours
<cours>Introduction à la régression dans R</cours>Exercice interactif pratique
Transformez la théorie en action avec l’un de nos exercices interactifs
 Commencer l’exercice