Résidus par rapport aux valeurs ajustées
Vous pouvez observer ici les graphiques diagnostiques des résidus par rapport aux valeurs ajustées pour deux modèles de conversion publicitaire.
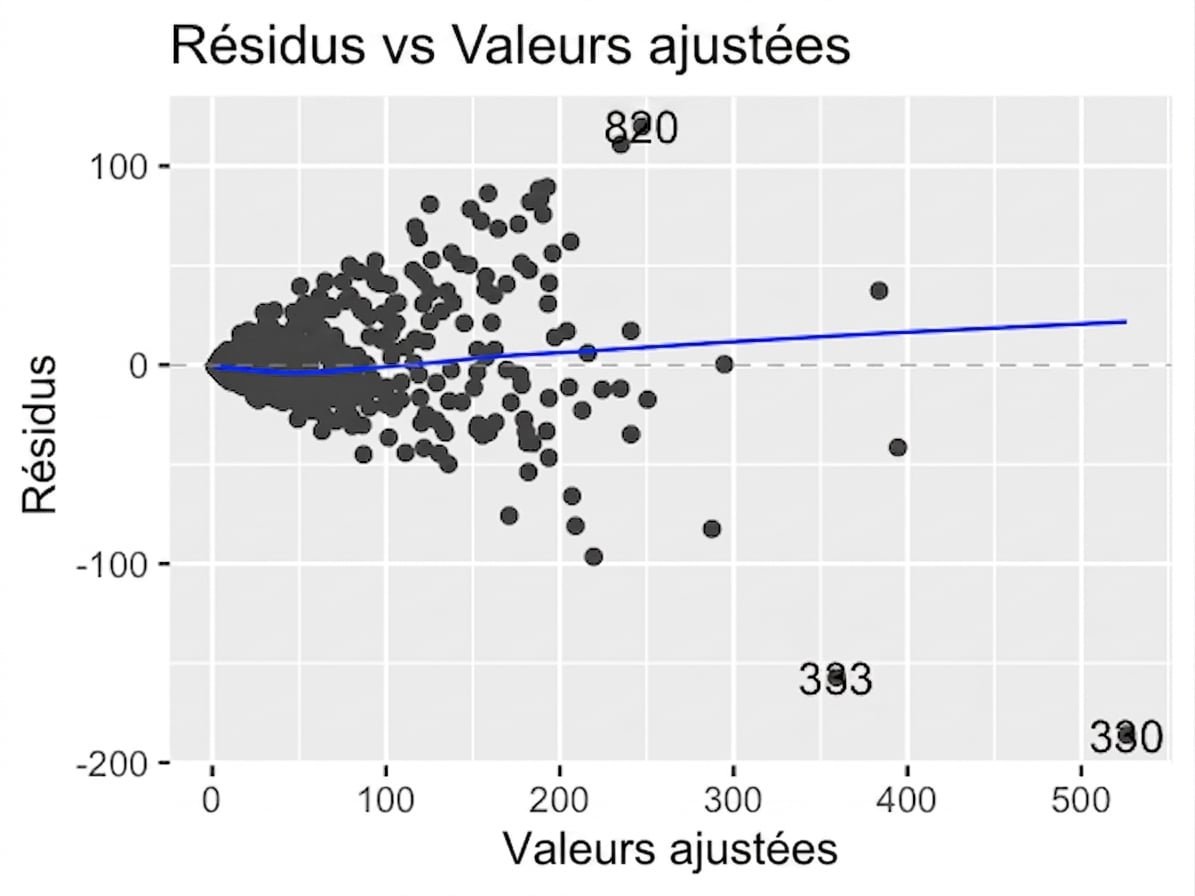
Modèle original (n_clicks par rapport à n_impressions)
Modèle transformé (n_clicks ^ 0.25 par opposition à n_impressions ^ 0.25)
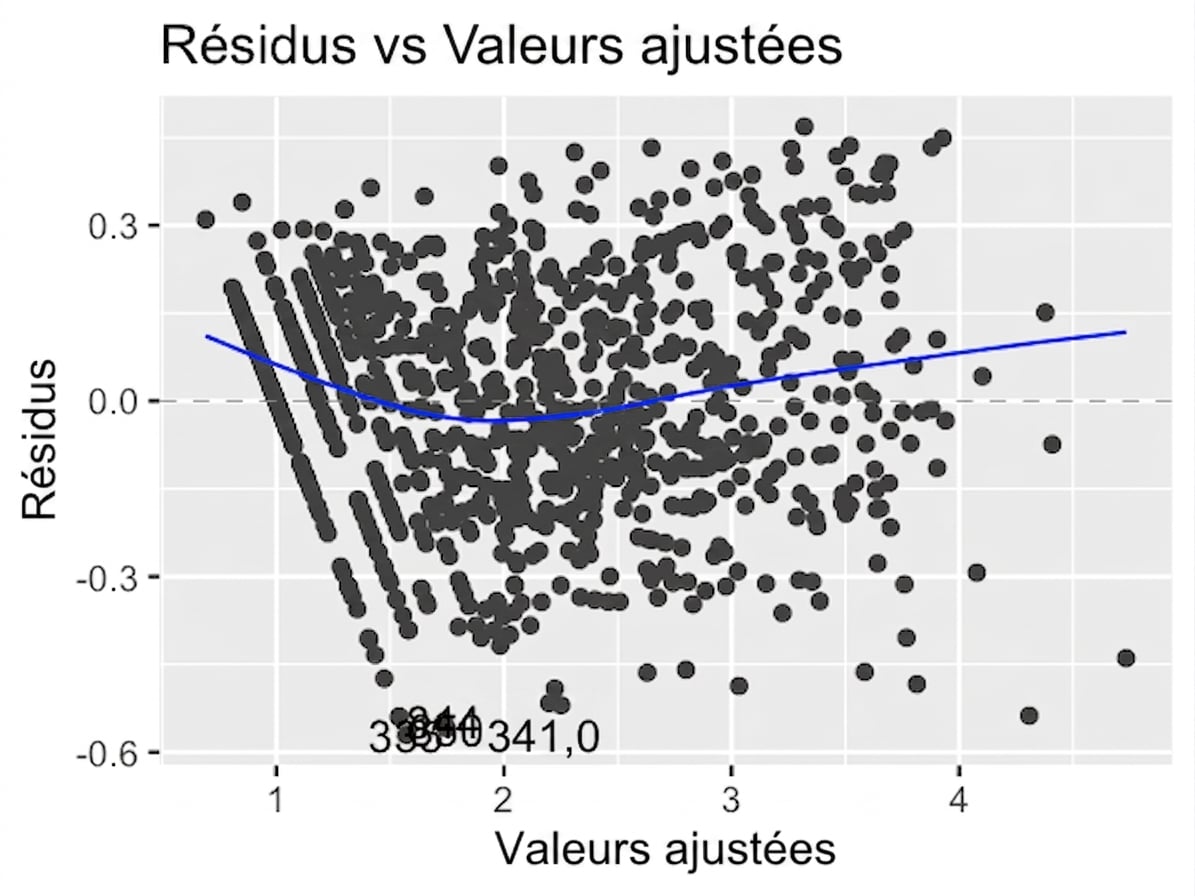
Examinez les chiffres sur l'échelle de l'axe des y et la manière dont les courbes de tendance suivent la ligne \(y = 0\). Quelle affirmation est vraie ?
Cet exercice fait partie du cours
<cours>Introduction à la régression dans R</cours>Exercice interactif pratique
Transformez la théorie en action avec l’un de nos exercices interactifs
 Commencer l’exercice