Clasificador de vecinos relacionales
En este ejercicio, vas a aplicar un clasificador sencillo basado en redes llamado relational neighbor classifier.
Usa las etiquetas de clase de los nodos vecinos para calcular la probabilidad de churn de cada nodo de la red.
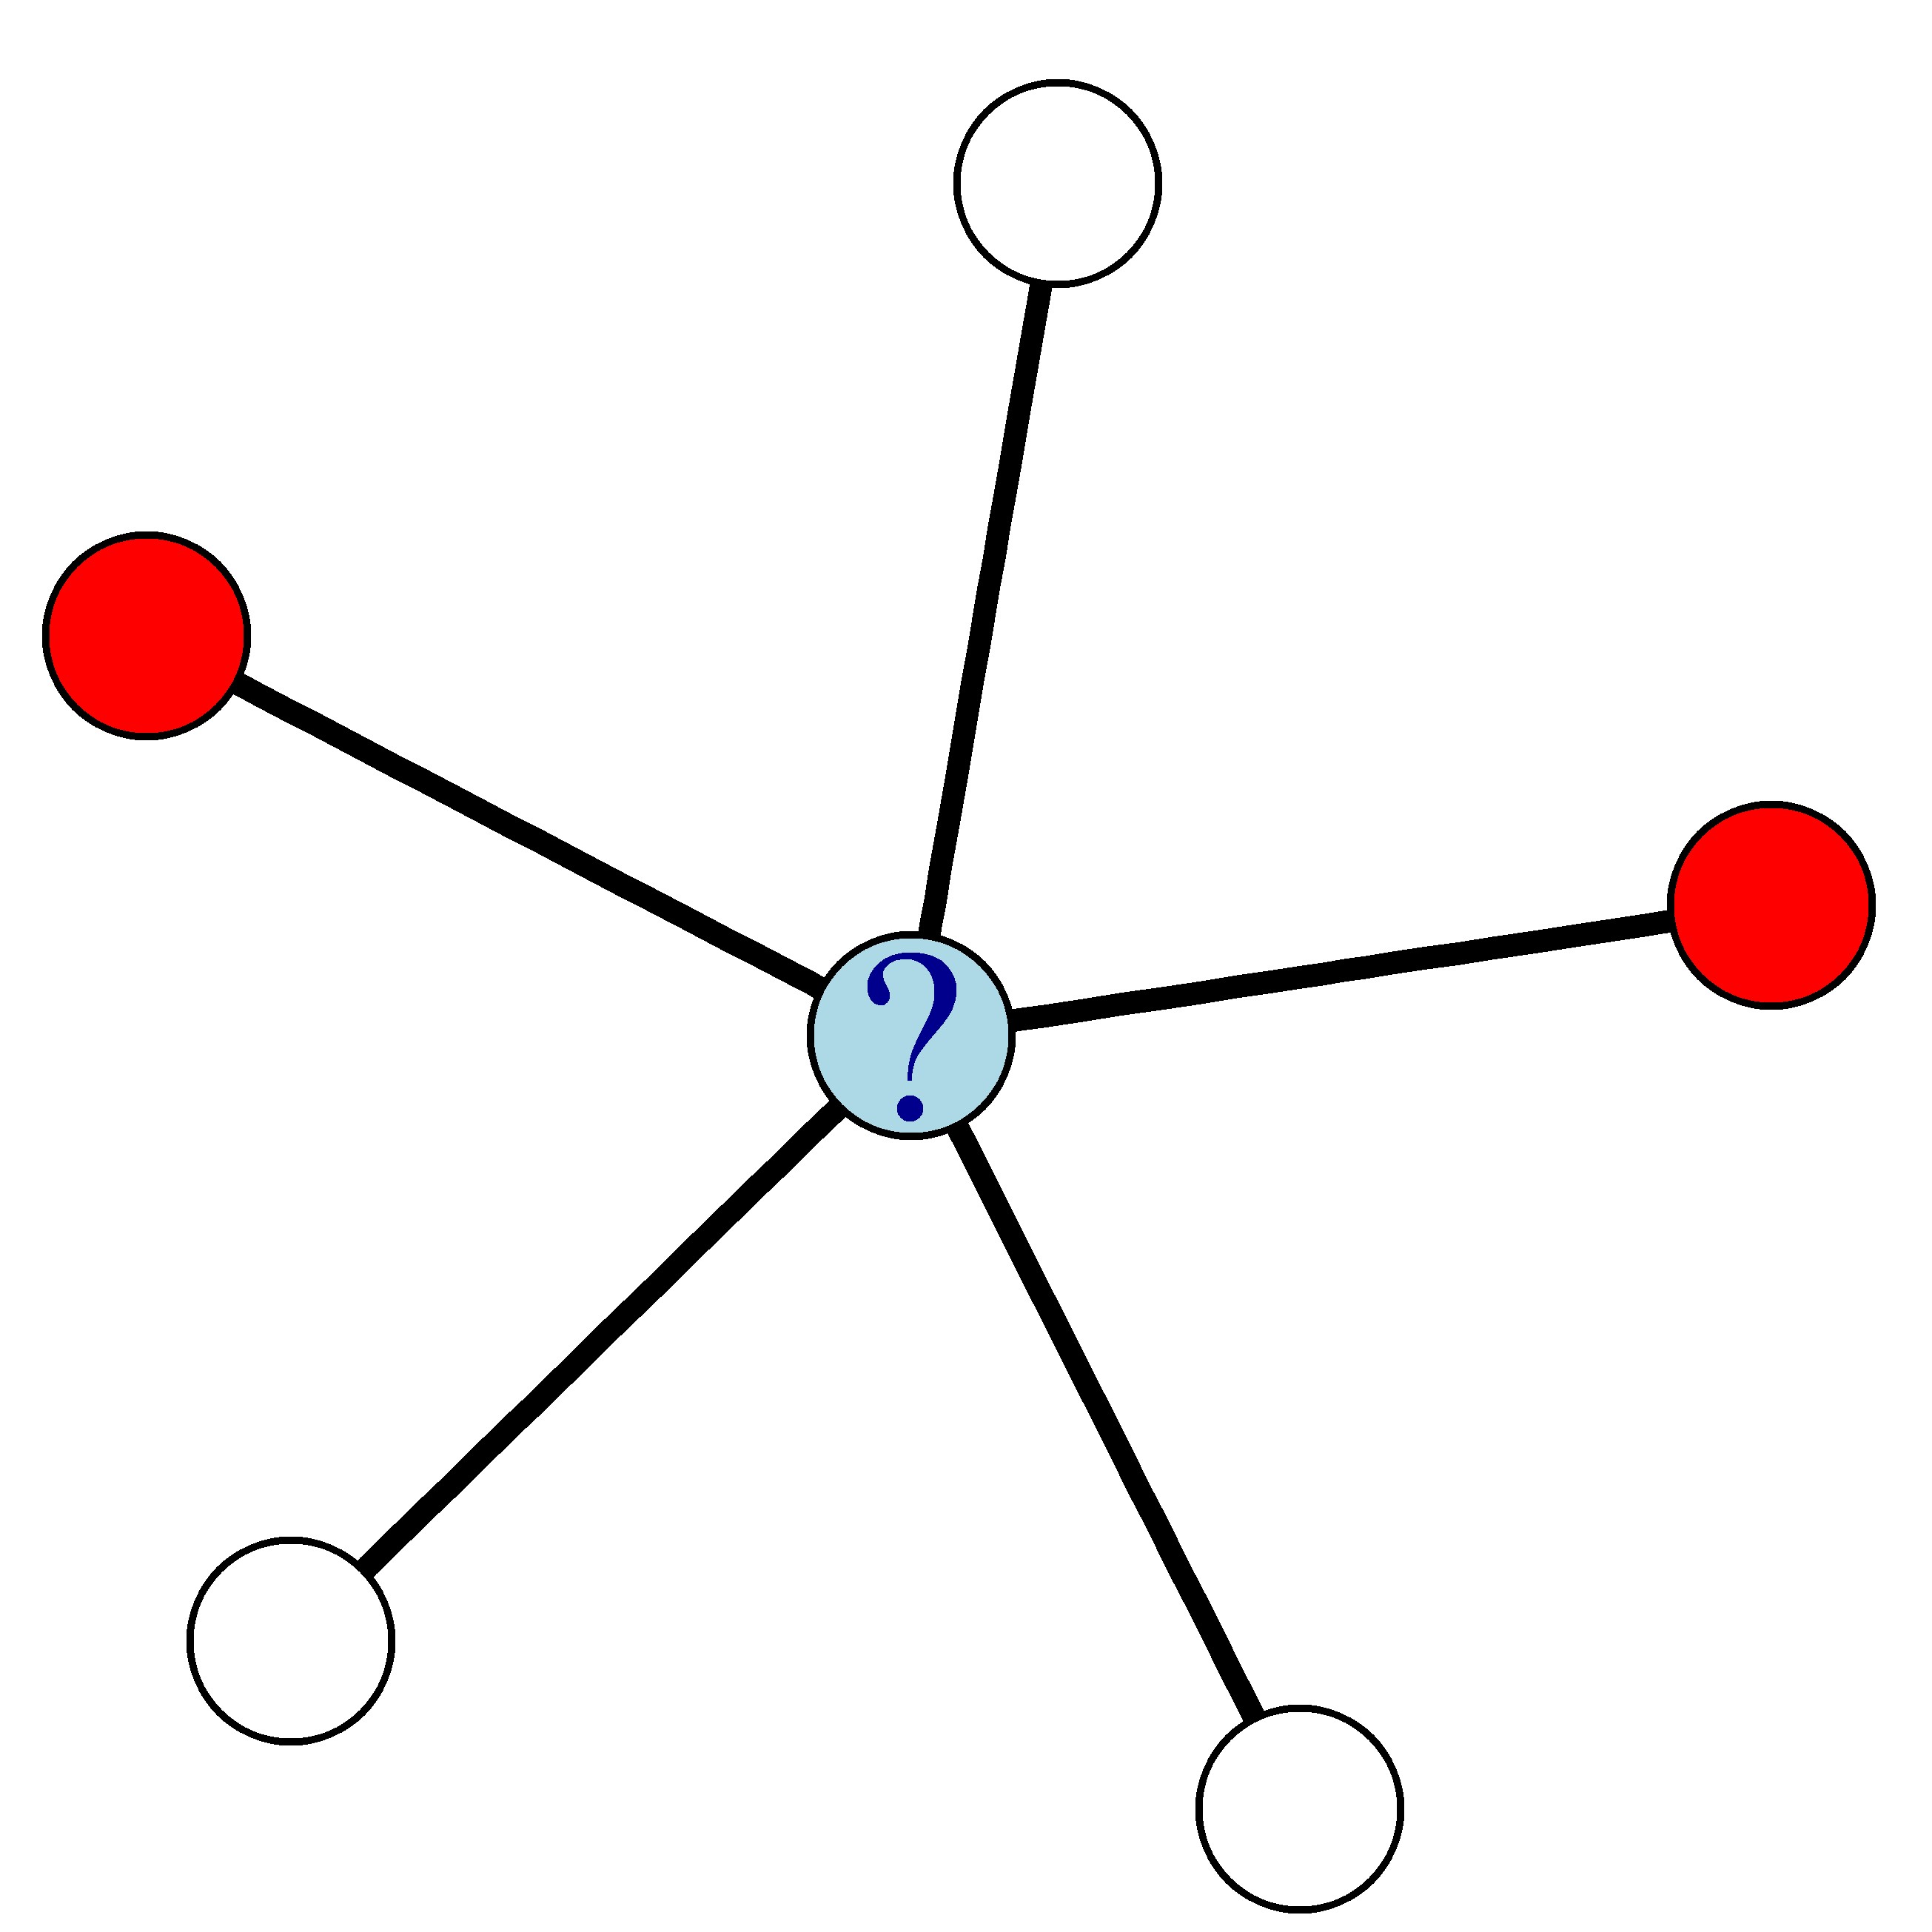
Por ejemplo, en la red de abajo, donde los nodos rojos representan clientes que hacen churn y los blancos los que no, la probabilidad de churn del nodo azul es 0.4.
Se te proporcionan dos vectores: ChurnNeighbors y NonChurnNeighbors, con el número de vecinos de cada cliente que han hecho churn y que no lo han hecho, respectivamente.
Este ejercicio forma parte del curso
Analítica predictiva con datos conectados en R
Instrucciones del ejercicio
- Calcula la probabilidad de churn de cada cliente,
churnProb, usando el clasificador de vecinos relacionales. - Usa
which()para encontrar los clientes con la probabilidad más alta de churn. Llama a este vectormostLikelyChurners. - Usa
mostLikelyChurnerspara obtener los IDs de los clientes con la probabilidad de churn más alta.
ejercicio interactivo práctico
Prueba este ejercicio completando este código de ejemplo.
# Compute the churn probabilities
churnProb <- ___ / (ChurnNeighbors + ___)

# Find who is most likely to churn
mostLikelyChurners <- which(churnProb == ___(churnProb))

# Extract the IDs of the most likely churners
customers$id[___]