Kontingenztafeln verstehen
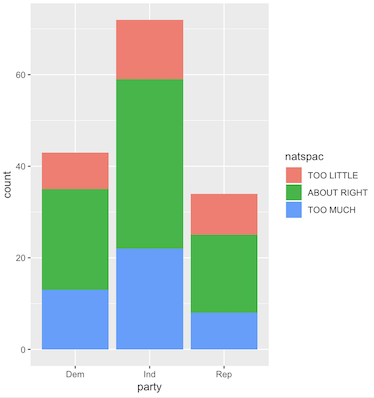
Das Balkendiagramm der Häufigkeiten, das du erstellt hast, ist eine visuelle Darstellung einer Kontingenztafel.
Welche der folgenden Aussagen ist FALSCH in Bezug auf Kontingenztafeln?
Diese Übung ist Teil des Kurses
<Kurs>Schlussfolgern für kategoriale Daten in R</Kurs>Interaktive praktische Übung
Verwandle Theorie mit einer unserer interaktiven Übungen in die Praxis
 Übung starten