Vẽ mô hình lên trên dữ liệu
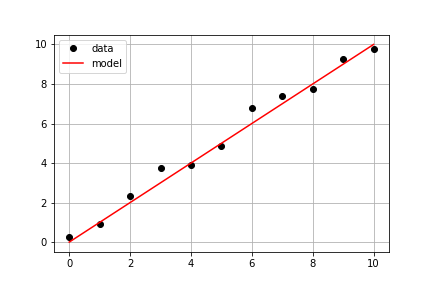
Tiếp tục với cùng bộ dữ liệu đo được từ bài tập trước, mục tiêu của bạn là dùng model() đã định nghĩa sẵn cùng dữ liệu đo times và measured_distances để tính các khoảng cách mô hình hóa, rồi vẽ cả dữ liệu đo và dữ liệu mô hình trên cùng một trục.
Bài tập này là một phần của khóa học
Nhập môn Mô hình tuyến tính với Python
Hướng dẫn bài tập
- Dùng
model_distances = model(times, measured_distances)để tính các giá trị mô hình. - Dùng
plt.subplots()để tạo đối tượng figure và axis. - Dùng
axis.plot()để vẽtimesso vớimeasured_distancesvới các tùy chọnlinestyle=" ", marker="o", color="black". - Dùng
axis.plot()để vẽ thêmtimesso vớimodel_distancesvới các tùy chọnlinestyle="-", color="red".
Bài tập tương tác thực hành trực tiếp
Hãy thử làm bài tập này bằng cách hoàn thành đoạn mã mẫu này.
# Pass times and measured distances into model
model_distances = model(____, ____)

# Create figure and axis objects and call axis.plot() twice to plot data and model distances versus times
fig, axis = plt.subplots()
axis.plot(____, ____, linestyle="____", marker="____", color="____", label="Measured")
axis.plot(____, ____, linestyle="____", marker=None, color="____", label="Modeled")

# Add grid lines and a legend to your plot, and then show to display
axis.grid(True)
axis.legend(loc="best")
plt.show()