Interpret partial autocorrelation plots
If partial autocorrelation values are close to 0, then values between observations and lagged observations are not correlated with one another. Inversely, partial autocorrelations with values close to 1 or -1 indicate that there exists strong positive or negative correlations between the lagged observations of the time series.
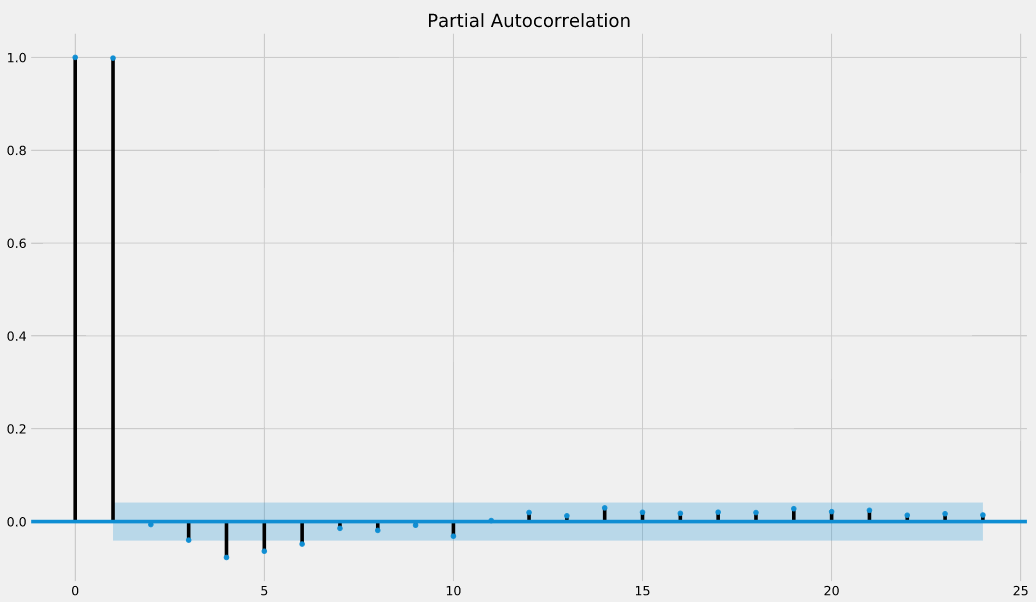
The .plot_pacf() function also returns confidence intervals, which are represented as blue shaded regions. If partial autocorrelation values are beyond this confidence interval regions, then you can assume that the observed partial autocorrelation values are statistically significant.
In the partial autocorrelation plot below, at which lag values do we have statistically significant partial autocorrelations?
Bu egzersiz, kursun bir parçasıdır
Visualizing Time Series Data in Python
Uygulamalı etkileşimli egzersiz
Teoriyi etkileşime dönüştürün, interaktif egzersizlerimizden biriyle
 Egzersize başla