โมเดลเชิงเส้นในสมุทรศาสตร์
ข้อมูลอนุกรมเวลาเป็นบริบทที่ "ความชัน" ของโมเดลเชิงเส้นแทนความหมายของ "อัตราการเปลี่ยนแปลง"
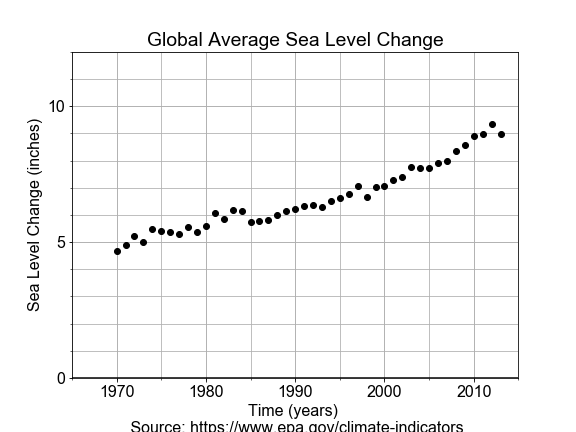
ในแบบฝึกหัดนี้ คุณจะใช้ข้อมูลการเปลี่ยนแปลงระดับน้ำทะเลตั้งแต่ปี 1970 ถึง 2010 สร้างโมเดลเชิงเส้นของระดับน้ำทะเลที่เปลี่ยนแปลง และนำไปพยากรณ์ระดับน้ำทะเลในอนาคต
แบบฝึกหัดนี้เป็นส่วนหนึ่งของหลักสูตร
Introduction to Linear Modeling in Python
คำแนะนำการฝึกหัด
- นำเข้าและใช้
LinearRegression(fit_intercept=True)เพื่อสร้างโมเดลเชิงเส้น - ส่งข้อมูล
yearsและlevelsที่โหลดและปรับรูปร่างไว้แล้วเข้าสู่model.fit()เพื่อฟิตโมเดล - ใช้
model.predict()เพื่อพยากรณ์ค่าfuture_levelเพียงค่าเดียวสำหรับfuture_year = 2100แล้วprint()ผลลัพธ์ที่ได้ - ใช้
model.predict()เพื่อพยากรณ์levels_forecastหลายค่า และพล็อตผลลัพธ์ด้วยฟังก์ชันplot_data_and_forecast()ที่กำหนดไว้แล้ว
แบบฝึกหัดเชิงโต้ตอบแบบลงมือทำ
ลองทำแบบฝึกหัดนี้โดยเติมโค้ดตัวอย่างนี้ให้สมบูรณ์
# Import LinearRegression class, build a model, fit to the data
from sklearn.linear_model import ____
model = ____(fit_intercept=True)
model.fit(years, levels)

# Use model to make a prediction for one year, 2100
future_year = np.array(2100).reshape(1, -1)
future_level = model.predict(____)
print("Prediction: year = {}, level = {:.02f}".format(future_year, future_level[0,0]))

# Use model to predict for many years, and over-plot with measured data
years_forecast = np.linspace(1970, 2100, 131).reshape(-1, 1)
levels_forecast = model.predict(____)
fig = plot_data_and_forecast(years, levels, ____, ____)