การพล็อตข้อมูล
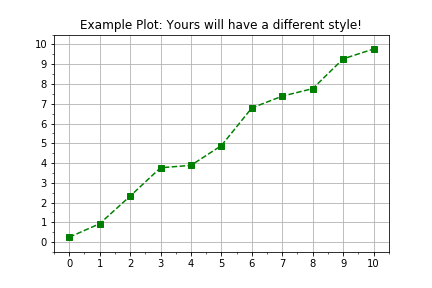
ใน Python ทุกอย่างเป็นออบเจ็กต์ แม้แต่โมดูล แบบฝึกหัดนี้ให้ทบทวนการใช้งานอินเทอร์เฟซเชิงออบเจ็กต์ของไลบรารี matplotlib เพื่อแสดงผลข้อมูลในรูปแบบที่ยืดหยุ่นและขยายได้มากขึ้น ขั้นตอนการพล็อตโดยทั่วไปมีดังนี้
import matplotlib.pyplot as plt
fig, axis = plt.subplots()
axis.plot(x, y, color="green", linestyle="--", marker="s")
plt.show()
แบบฝึกหัดนี้เป็นส่วนหนึ่งของหลักสูตร
Introduction to Linear Modeling in Python
คำแนะนำการฝึกหัด
- ใช้
plt.subplots()เพื่อสร้างออบเจ็กต์ figure และ axis - ข้อมูลถูกเตรียมไว้ให้แล้วในอาร์เรย์
numpyสองชุด ได้แก่timesและdistances - ใช้
axis.plot()เพื่อพล็อตtimesบนแกนนอน และdistancesบนแกนตั้ง - ระบุ keyword arguments
linestyle=" ",marker="o"และcolor="red"เมื่อเรียกใช้axis.plot()
แบบฝึกหัดเชิงโต้ตอบแบบลงมือทำ
ลองทำแบบฝึกหัดนี้โดยเติมโค้ดตัวอย่างนี้ให้สมบูรณ์
# Create figure and axis objects using subplots()
fig, axis = plt.____()

# Plot line using the axis.plot() method
line = axis.plot(____ , ____ , linestyle="____", marker="____", color="____")

# Use the plt.show() method to display the figure
plt.____()