พล็อตโมเดลบนข้อมูล
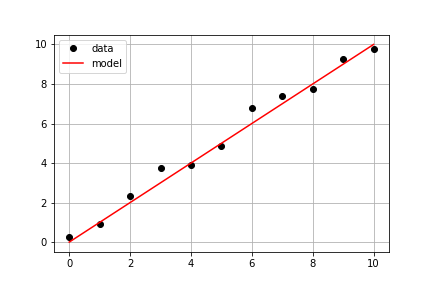
ต่อจากแบบฝึกหัดก่อนหน้าโดยใช้ข้อมูลที่วัดได้ชุดเดิม เป้าหมายคือการใช้ฟังก์ชัน model() ที่กำหนดไว้แล้ว พร้อมกับข้อมูล times และ measured_distances เพื่อคำนวณระยะทางจากโมเดล จากนั้นพล็อตทั้งข้อมูลที่วัดได้และข้อมูลจากโมเดลบนแกนเดียวกัน
แบบฝึกหัดนี้เป็นส่วนหนึ่งของหลักสูตร
Introduction to Linear Modeling in Python
คำแนะนำการฝึกหัด
- ใช้
model_distances = model(times, measured_distances)เพื่อคำนวณค่าจากโมเดล - ใช้
plt.subplots()เพื่อสร้าง object ของ figure และ axis - ใช้
axis.plot()เพื่อพล็อตtimesกับmeasured_distancesโดยกำหนดlinestyle=" ", marker="o", color="black" - ใช้
axis.plot()เพื่อพล็อตtimesกับmodel_distancesโดยกำหนดlinestyle="-", color="red"
แบบฝึกหัดเชิงโต้ตอบแบบลงมือทำ
ลองทำแบบฝึกหัดนี้โดยเติมโค้ดตัวอย่างนี้ให้สมบูรณ์
# Pass times and measured distances into model
model_distances = model(____, ____)

# Create figure and axis objects and call axis.plot() twice to plot data and model distances versus times
fig, axis = plt.subplots()
axis.plot(____, ____, linestyle="____", marker="____", color="____", label="Measured")
axis.plot(____, ____, linestyle="____", marker=None, color="____", label="Modeled")

# Add grid lines and a legend to your plot, and then show to display
axis.grid(True)
axis.legend(loc="best")
plt.show()