Interpretação de gráficos de insight dos preditores
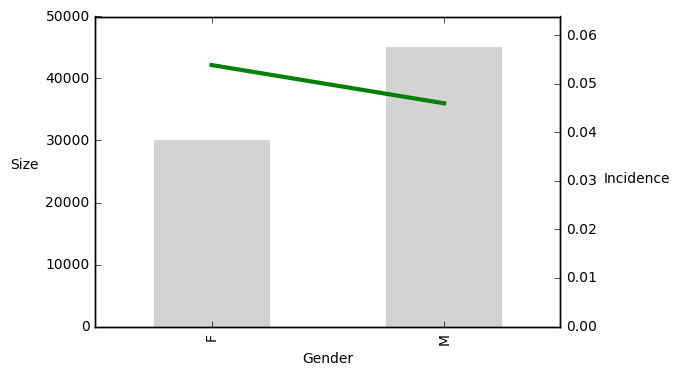
Considere o gráfico de insight do preditor que indica a relação entre a incidência do alvo e o gênero (M - masculino, F - feminino) do possível doador. As barras indicam o tamanho dos grupos; a linha indica a porcentagem do alvo.
Este exercicio faz parte do curso
Introdução à Análise Preditiva em Python
exercicio interativo prático
Transforme teoria em prática com um dos nossos exercicio interativos
 Iniciar exercicio