Bootstrapped regressions
While working for the Long Beach parks and recreation department investigating the relationship between NO2 and SO2 you noticed a cluster of potential outliers that you suspect might be throwing off the correlations.
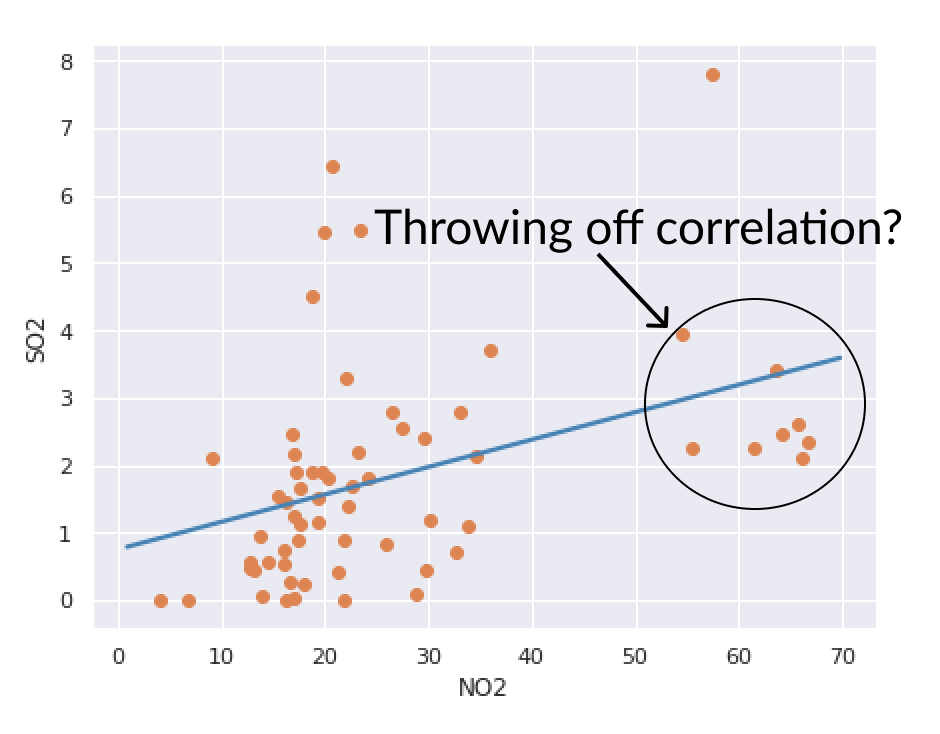
Investigate the uncertainty of your correlations through bootstrap resampling to see how stable your fits are. For convenience, the bootstrap sampling is complete and is provided as no2_so2_boot along with no2_so2 for the non-resampled data.
Este exercicio faz parte do curso
Improving Your Data Visualizations in Python
Instruções do exercicio
- Let
sns.lmplot()know that it needs to draw a separate regression line for each bootstrapsample. - Color every regression line
'steelblue'and make them 20% opaque. - Disable the default Seaborn confidence bands around the regression lines.
exercicio interativo prático
Tente este exercicio completando este código de exemplo.
sns.lmplot('NO2', 'SO2', data = no2_so2_boot,
           # Tell seaborn to a regression line for each sample
           ____ = 'sample',
           # Make lines blue and transparent
           line_kws = {'____': 'steelblue', '____': 0.2},
           # Disable built-in confidence intervals
           ci = ____, legend = False, scatter = False)

# Draw scatter of all points
plt.scatter('NO2', 'SO2', data = no2_so2)

plt.show()