Understanding KPI chart trends
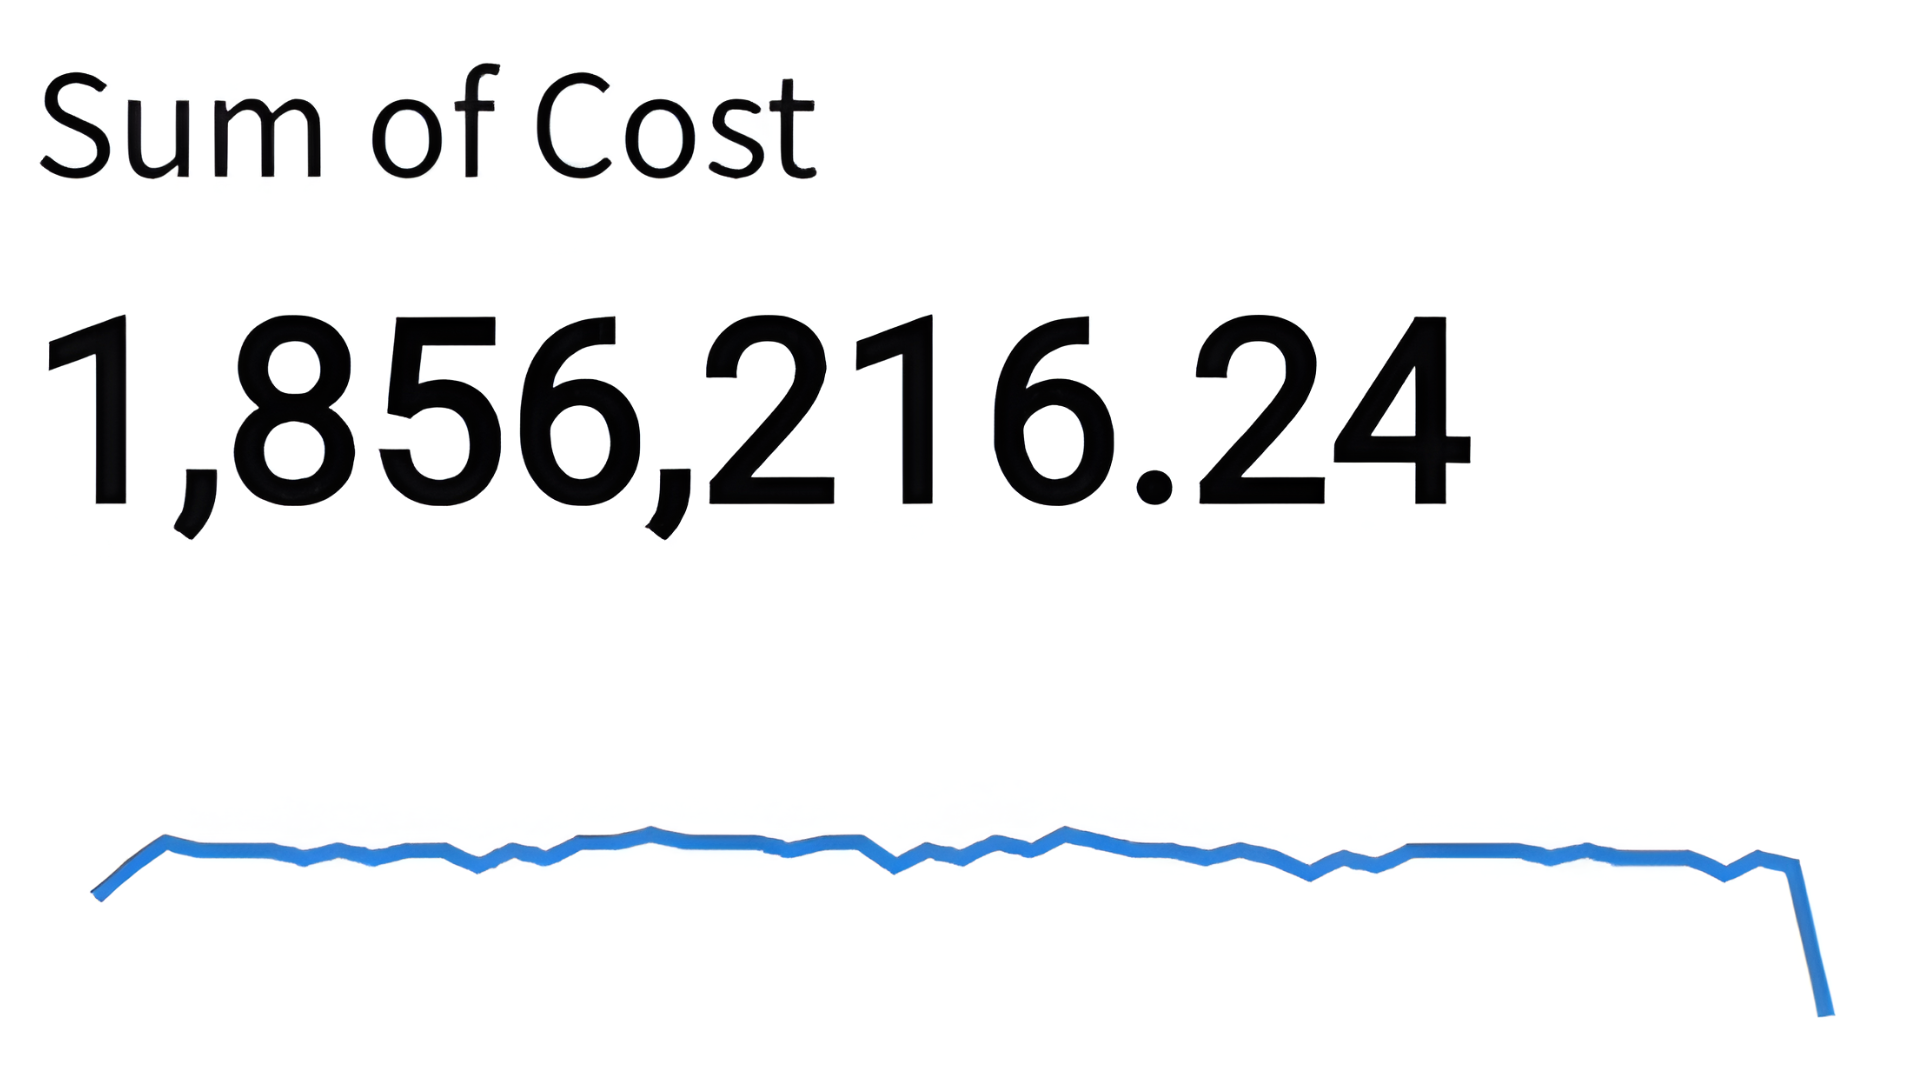
The line under this KPI chart is called the (A). It requires a field to be dropped on the chart’s timeline menu, and (B) for all KPI charts.
Deze oefening maakt deel uit van de cursus
Visualizations in Sigma
Interactieve oefening met praktijkervaring
Zet theorie om in actie met een van onze interactieve oefeningen
 Begin oefening