추세 주변의 변동
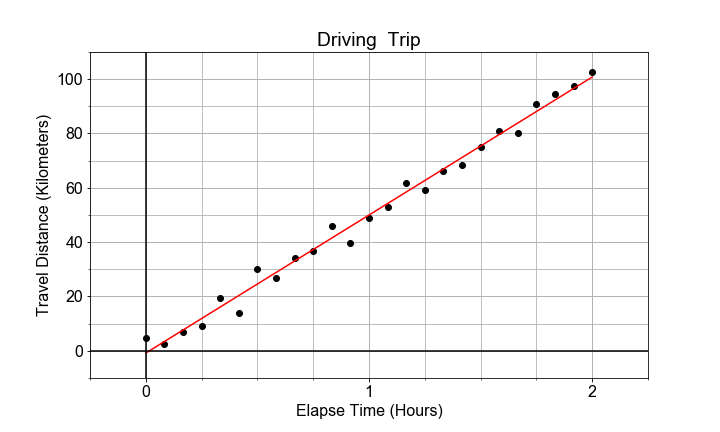
데이터가 완벽히 선형일 필요는 없으며, 측정값에는 무작위적인 변동, 즉 어느 정도의 "퍼짐"이 있을 수 있어요. 이는 모델 매개변수의 변동으로 이어집니다. 이러한 매개변수의 변동은 "표준 오차"로 정량화되며, 모델 매개변수 추정치의 "불확실성"으로 해석해요.
이 연습 문제에서는 statsmodels의 ols를 사용해 모델을 만들고, 그 모델의 각 매개변수에 대한 표준 오차를 추출해 보겠습니다.
이 연습은 강의의 일부입니다
Python으로 배우는 선형 모델 입문
연습 안내
- 미리 로드된 데이터를 DataFrame
df에 저장하고,x_data는times,y_data는distances라는 열 이름으로 지정하세요. model_fit = ols().fit()을 사용해 선형 모델을 적합하세요.data=df에 대해formula="distances ~ times"형태를 사용합니다.- 추정된 절편은
model_fit.params['Intercept']에서, 절편의 표준 오차는model_fit.bse['Intercept']에서 추출하세요. - 기울기에 대해서도 동일하게 수행한 뒤, 네 값을 의미 있는 이름과 함께 출력하세요.
실습형 인터랙티브 연습
이 예제를 이 샘플 코드를 완성하여 풀어보세요.
# Store x_data and y_data, as times and distances, in df, and use ols() to fit a model to it.
df = pd.DataFrame(dict(____=x_data, ____=y_data))
model_fit = ols(____="distances ~ times", data=____).____()

# Extact the model parameters and their uncertainties
a0 = model_fit.____['Intercept']
e0 = model_fit.____['Intercept']
a1 = model_fit.____['times']
e1 = model_fit.____['times']

# Print the results with more meaningful names
print('Estimate    of the intercept = {:0.2f}'.format(____))
print('Uncertainty of the intercept = {:0.2f}'.format(____))
print('Estimate    of the slope = {:0.2f}'.format(____))
print('Uncertainty of the slope = {:0.2f}'.format(____))