기울기와 변화율
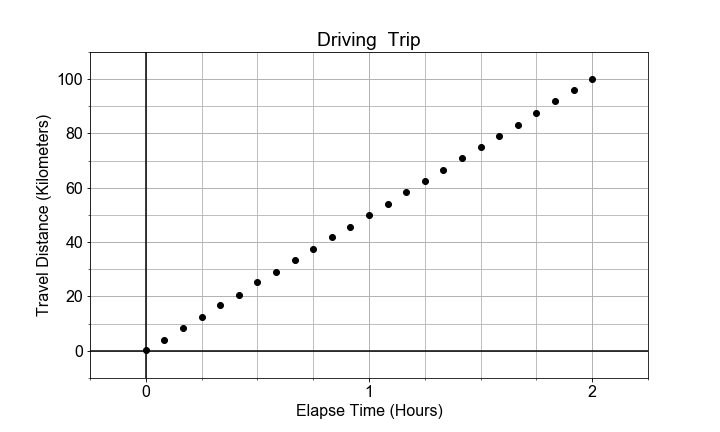
이 연습 문제에서는 자동차가 (대략) 일정한 속도로 주행한다고 보고, 전체 여행 구간의 평균 속도를 계산해 차량의 운동을 모델링해 봅니다. 여기서 선형 관계는 경과 시간과 이동 거리 사이에서 성립합니다.
이 경우 모델 매개변수 a1(기울기)은 평균 속도로 근사(또는 “추정”)하며, 다시 말해 거리(“rise”)의 변화량을 시간(“run”)으로 나눈, 즉 변화율로 해석합니다.
이 연습은 강의의 일부입니다
Python으로 배우는 선형 모델 입문
연습 안내
numpy.diff()를 사용해times와distances의 점간(point-to-point) 차이를 각각 계산하세요.diff_distance를diff_times로 나눈 비율로velocities배열을 계산하세요.numpy의mean,max,min메서드를 사용해 속도 값의 평균과 범위를 계산하세요.velocities배열을 플로팅하여 평균과 분포(퍼짐)를 시각화하세요.
실습형 인터랙티브 연습
이 예제를 이 샘플 코드를 완성하여 풀어보세요.
# Compute an array of velocities as the slope between each point
diff_distances = np.diff(____)
diff_times = np.diff(____)
velocities = ____ / diff_times

# Chracterize the center and spread of the velocities
v_avg = np.____(velocities)
v_max = np.____(velocities)
v_min = np.____(velocities)
v_range = ____ - ____

# Plot the distribution of velocities
fig = plot_velocity_timeseries(times[1:], velocities)