부트스트랩과 표준 오차
국립공원에서 공원관리원이 매일 산책로를 관리하기 위해 하이킹을 합니다. 매번 같은 경로를 가는 것은 아니지만, 최종 이동 거리와 시간을 기록해요. 우리는 한 명의 관리원으로부터 얻은 제한된 표본 데이터를 바탕으로, 일일 이동 거리의 변동성을 설명하는 통계 모형을 만들고자 합니다.
여러분의 목표는 부트스트랩 리샘플링을 사용해 각 재표집마다 평균을 하나씩 계산하여 평균의 분포를 만들고, 그 분포로부터 표준 오차를 계산해 모집단 통계량의 추정치로서 표본 통계량이 가지는 "불확실성"을 수치화하는 거예요.
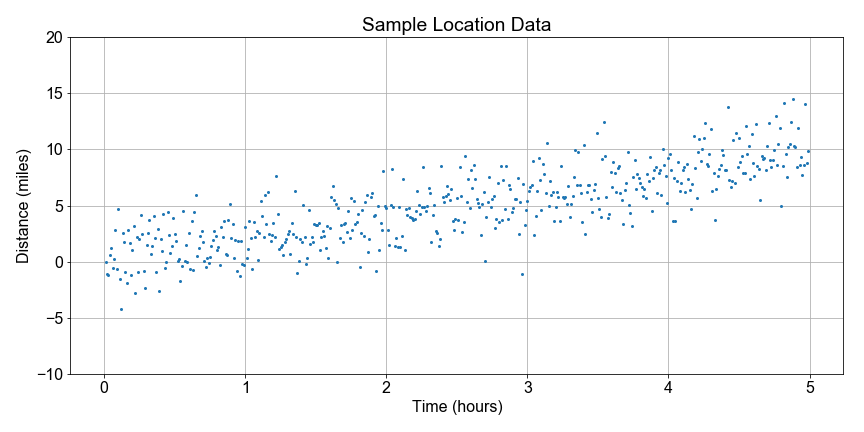
사전 로드된 sample_data 배열에는 이동 거리에 대한 500개의 독립 측정값이 들어 있습니다. 이번 연습에서는 내용을 단순화하기 위해 모의 데이터를 사용해요. 이후에는 더 현실적인 데이터를 다뤄 보겠습니다.
이 연습은 강의의 일부입니다
Python으로 배우는 선형 모델 입문
연습 안내
sample_data를 모집단에 대한 모형으로 설정하세요.num_resamples만큼 반복하세요:- 매번
np.random.choice()를 사용해population_model에서size=resample_size,replace=True로 추출한bootstrap_sample을 생성하세요. - 매번 표본 평균을 계산해 저장하세요.
- 매번
bootstrap_means의np.mean()과np.std()를 계산해 출력하세요.미리 정의된
plot_data_hist()를 사용해bootstrap_means분포를 시각화하세요.
실습형 인터랙티브 연습
이 예제를 이 샘플 코드를 완성하여 풀어보세요.
# Use the sample_data as a model for the population
population_model = ____

# Resample the population_model 100 times, computing the mean each sample
for nr in range(num_resamples):
    bootstrap_sample = np.random.____(population_model, size=____, replace=____)
    bootstrap_means[nr] = np.____(bootstrap_sample)

# Compute and print the mean, stdev of the resample distribution of means
distribution_mean = np.mean(____)
standard_error = np.std(____)
print('Bootstrap Distribution: center={:0.1f}, spread={:0.1f}'.format(____, ____))

# Plot the bootstrap resample distribution of means
fig = plot_data_hist(____)