데이터에 모델 그리기
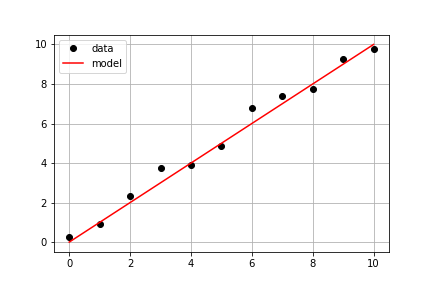
이전 연습 문제에서 사용한 동일한 측정 데이터를 이어서 사용해 봅시다. 미리 정의된 model()과 측정된 데이터 times, measured_distances를 사용해 모델에 따른 거리 값을 계산하고, 같은 축에 측정값과 모델값을 함께 그리는 것이 목표예요.
이 연습은 강의의 일부입니다
Python으로 배우는 선형 모델 입문
연습 안내
model_distances = model(times, measured_distances)로 모델 값을 계산하세요.plt.subplots()를 사용해 figure와 axis 객체를 만드세요.axis.plot()으로times대measured_distances를 그리되, 옵션linestyle=" ", marker="o", color="black"를 사용하세요.axis.plot()으로times대model_distances도 그리되, 옵션linestyle="-", color="red"를 사용하세요.
실습형 인터랙티브 연습
이 예제를 이 샘플 코드를 완성하여 풀어보세요.
# Pass times and measured distances into model
model_distances = model(____, ____)

# Create figure and axis objects and call axis.plot() twice to plot data and model distances versus times
fig, axis = plt.subplots()
axis.plot(____, ____, linestyle="____", marker="____", color="____", label="Measured")
axis.plot(____, ____, linestyle="____", marker=None, color="____", label="Modeled")

# Add grid lines and a legend to your plot, and then show to display
axis.grid(True)
axis.legend(loc="best")
plt.show()