Mass shootings: 出力を変更する
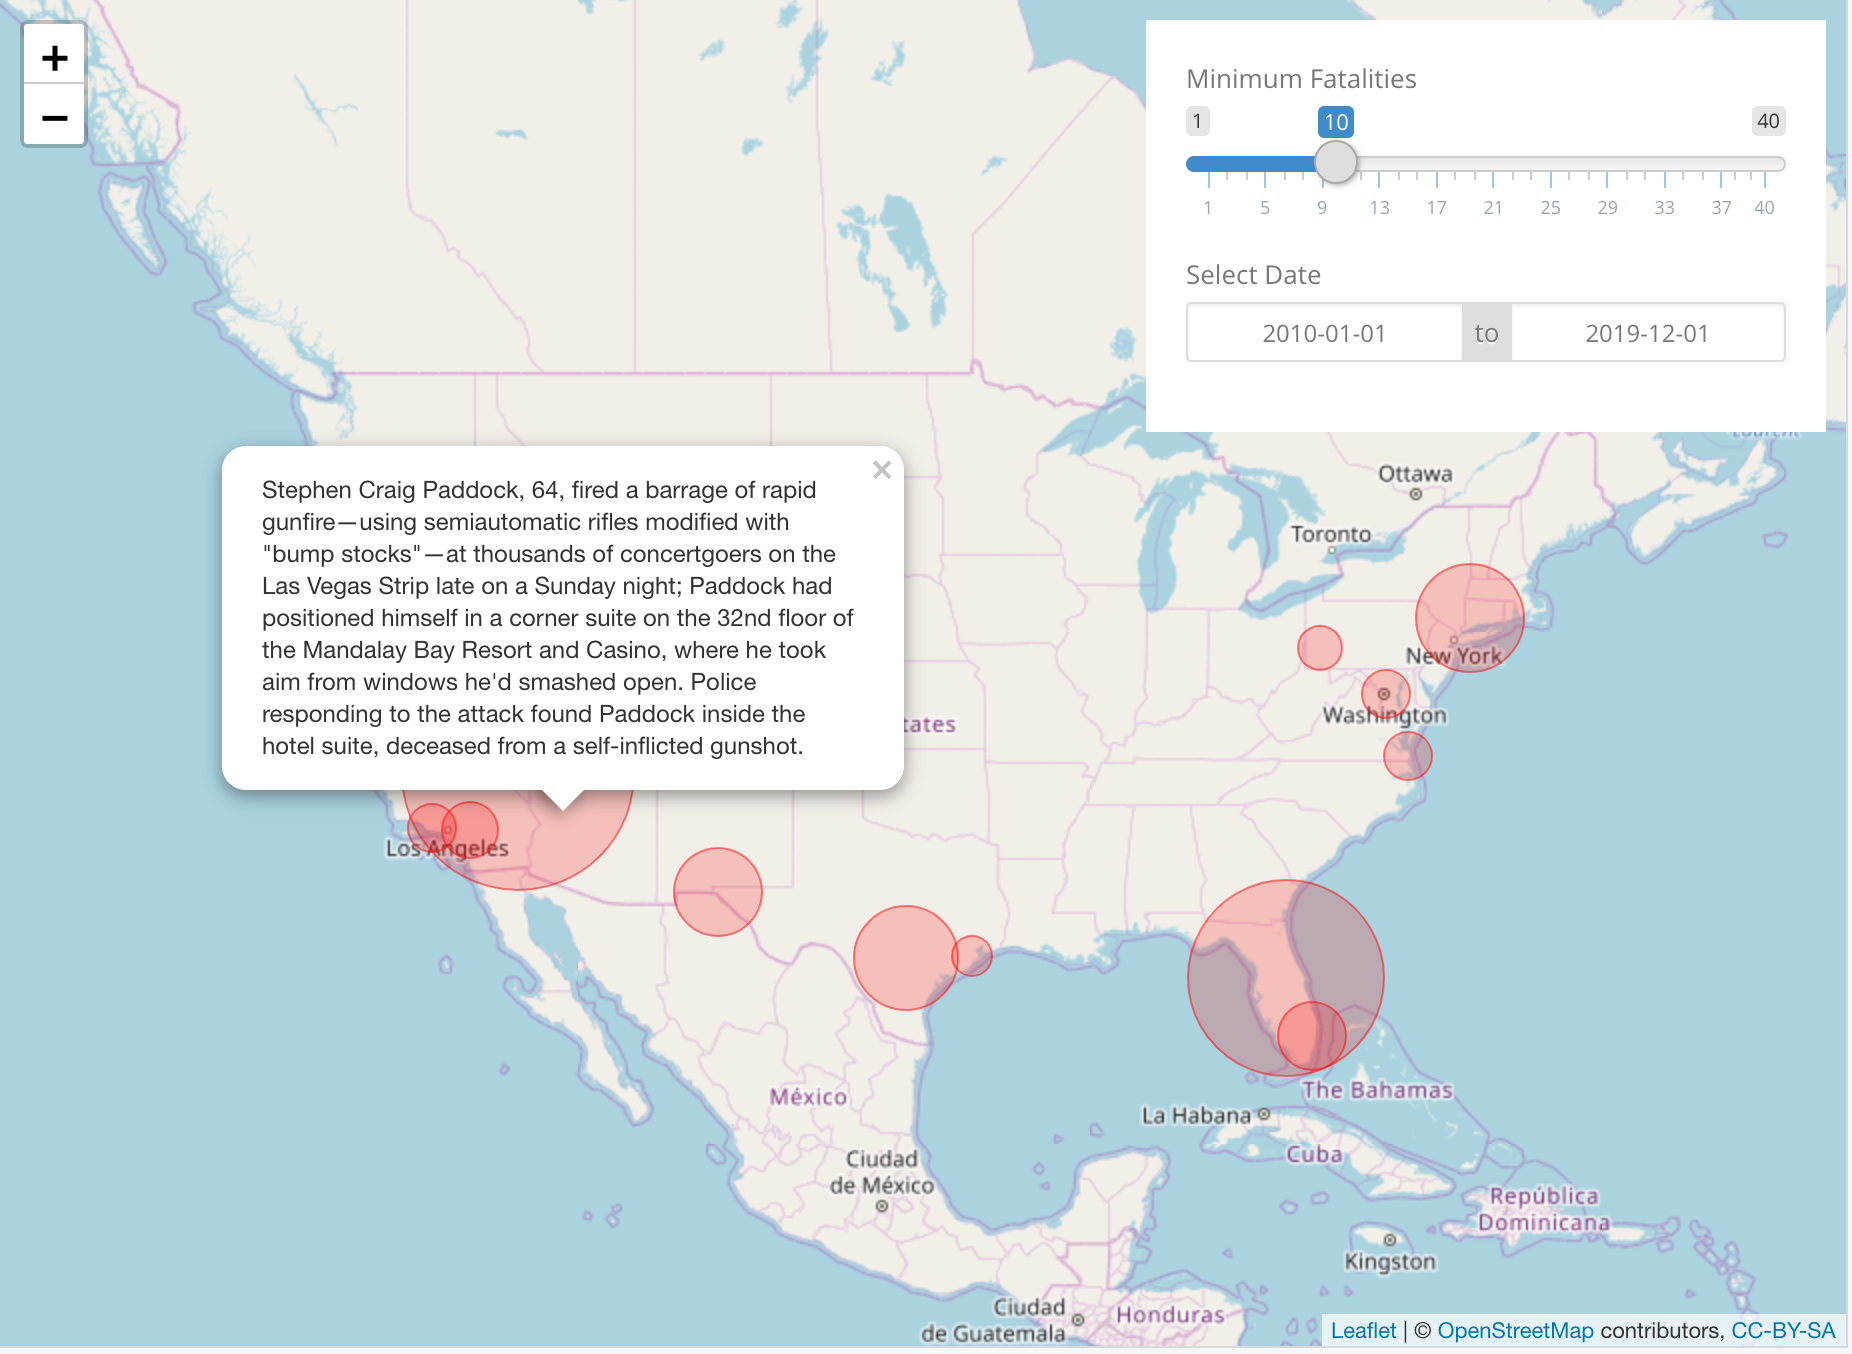
この演習では、前に作成した Shiny アプリを拡張し、死亡者数に応じた大きさの赤い円をインタラクティブマップに表示し、円をクリックすると事件の概要が表示されるようにします。アプリは次のスクリーンショットのようになります。
この演習はコースの一部です
Rで作るShiny Webアプリケーション
演習の手順
- リアクティブ式
rval_mass_shootingsを更新し、ユーザーが選択した死亡者数(nb_fatalities)と日付範囲(date_range)に基づいてデータセットを フィルタリングしてください。 addCircleMarkers()内のコードを更新し、円のradiusをfatalitiesに、popupパラメータをsummaryにマッピングしてください。 パラメータpをフィールドfにマッピングするにはp = ~ fのように指定できます。
実践的なインタラクティブ演習
このサンプルコードを完成させて、この演習に挑戦してみましょう。
ui <- bootstrapPage(
  theme = shinythemes::shinytheme('simplex'),
  leaflet::leafletOutput('map', height = '100%', width = '100%'),
  absolutePanel(top = 10, right = 10, id = 'controls',
    sliderInput('nb_fatalities', 'Minimum Fatalities', 1, 40, 10),
    dateRangeInput('date_range', 'Select Date', "2010-01-01", "2019-12-01")
  ),
  tags$style(type = "text/css", "
    html, body {width:100%;height:100%}
    #controls{background-color:white;padding:20px;}
  ")
)

server <- function(input, output, session) {
  rval_mass_shootings <- reactive({
    # MODIFY CODE BELOW: Filter mass_shootings on nb_fatalities and
    # selected date_range.
    mass_shootings


  })
  output$map <- leaflet::renderLeaflet({
    rval_mass_shootings() %>%
      leaflet() %>%
      addTiles() %>%
      setView( -98.58, 39.82, zoom = 5) %>%
      addTiles() %>%
      addCircleMarkers(
        # CODE BELOW: Add parameters popup and radius and map them
        # to the summary and fatalities columns

        fillColor = 'red', color = 'red', weight = 1
      )
  })
}

shinyApp(ui, server)