各国料理を探る:ワードクラウド
料理系の Shiny アプリ作り、楽しんでいただけていますか?大量のデータを手早く可視化するには、ワードクラウドが便利です。この演習では、前回作成した Shiny アプリを拡張し、特徴的な食材の上位をインタラクティブなワードクラウドで表示する新しいタブを追加します。
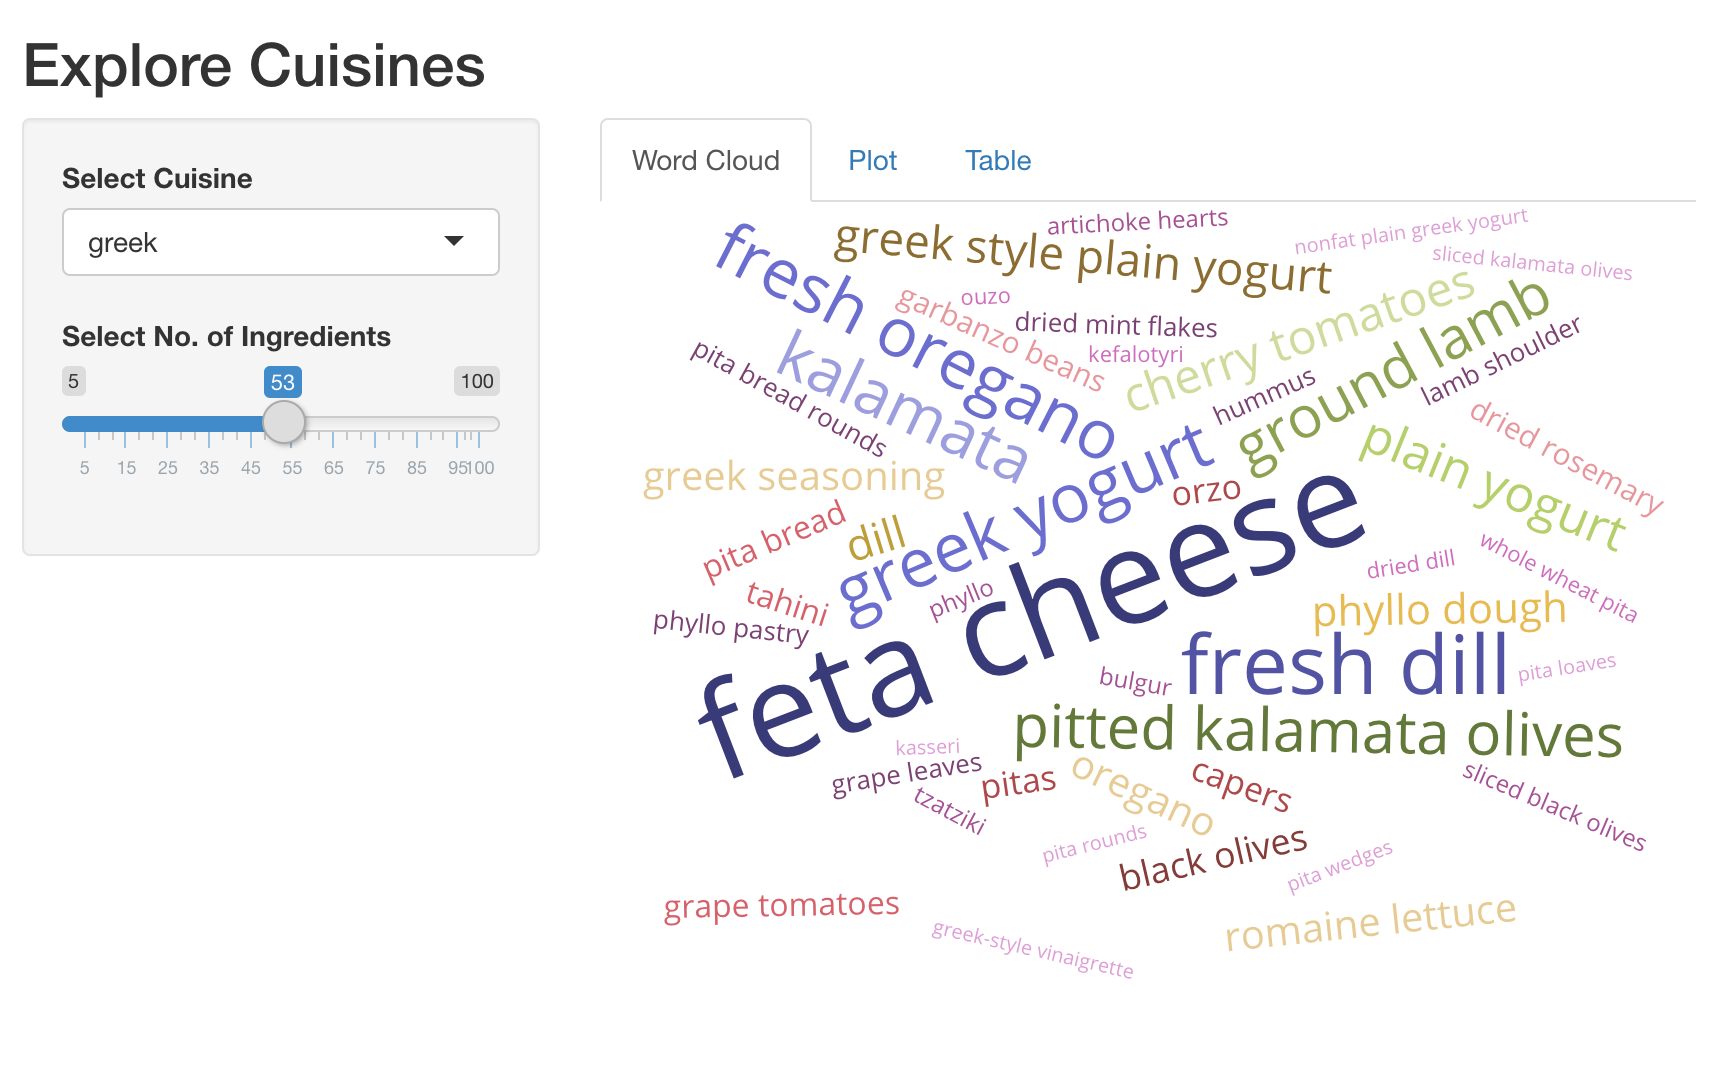
パッケージ shiny、dplyr、ggplot2、plotly、d3wordcloud はすでに読み込まれています。ワードクラウドを作るための便利なスニペットを示します。
d3wordcloud(
  words = c('hello', 'world', 'good'),
  freqs = c(20, 40, 30),
  tooltip = TRUE
)
この演習はコースの一部です
Rで作るShiny Webアプリケーション
演習の手順
- UI:
d3wordcloudOutput()をwc_ingredientsという名前で追加し、tabPanel()で包んでください。これはアプリ内で最初のtabPanel()にします。 - Server:上位食材と、それらが使われているレシピ数のインタラクティブなワードクラウドを
d3wordcloud::renderD3wordcloud()で描画し、出力名wc_ingredientsに割り当ててください。rval_top_ingredients()というリアクティブ式を使って、レシピ件数つき上位食材のデータフレームを取得する必要があります。
実践的なインタラクティブ演習
このサンプルコードを完成させて、この演習に挑戦してみましょう。
ui <- fluidPage(
  titlePanel('Explore Cuisines'),
  sidebarLayout(
    sidebarPanel(
      selectInput('cuisine', 'Select Cuisine', unique(recipes$cuisine)),
      sliderInput('nb_ingredients', 'Select No. of Ingredients', 5, 100, 20),
    ),
    mainPanel(
      tabsetPanel(
        # CODE BELOW: Add `d3wordcloudOutput` named `wc_ingredients` in a `tabPanel`

        tabPanel('Plot', plotly::plotlyOutput('plot_top_ingredients')),
        tabPanel('Table', DT::DTOutput('dt_top_ingredients'))
      )
    )
  )
)

server <- function(input, output, session){
  # CODE BELOW: Render an interactive wordcloud of top ingredients and
  # the number of recipes they get used in, using `d3wordcloud::renderD3wordcloud`,
  # and assign it to an output named `wc_ingredients`.


  rval_top_ingredients <- reactive({
    recipes_enriched %>%
      filter(cuisine == input$cuisine) %>%
      arrange(desc(tf_idf)) %>%
      head(input$nb_ingredients) %>%
      mutate(ingredient = forcats::fct_reorder(ingredient, tf_idf))
  })
  output$plot_top_ingredients <- plotly::renderPlotly({
    rval_top_ingredients() %>%
      ggplot(aes(x = ingredient, y = tf_idf)) +
      geom_col() +
      coord_flip()
  })
  output$dt_top_ingredients <- DT::renderDT({
    recipes %>%
      filter(cuisine == input$cuisine) %>%
      count(ingredient, name = 'nb_recipes') %>%
      arrange(desc(nb_recipes)) %>%
      head(input$nb_ingredients)
  })
}

shinyApp(ui = ui, server= server)