各国料理を探る:特徴的な食材(改)
各国料理には、その料理らしさを決める少数の特徴的な食材があります。最もよく使われる食材を見ても、それらは塩や砂糖のような基礎的な材料であることが多く、特徴は見えてきません。
この目的に役立つ別の指標が、term frequency–inverse document frequency(TFIDF)です。これは、コーパス(レシピ)の中の各ドキュメント(料理)において、ある単語(食材)がどれだけ重要かを表す数値指標です。
tf_idf はすでに計算済みで、recipes_enriched という拡張データセットにまとめてあります。目標は、tf_idf で測った各料理の「特徴的な上位食材」を横向きの棒グラフで表示する Shiny アプリを作ることです。
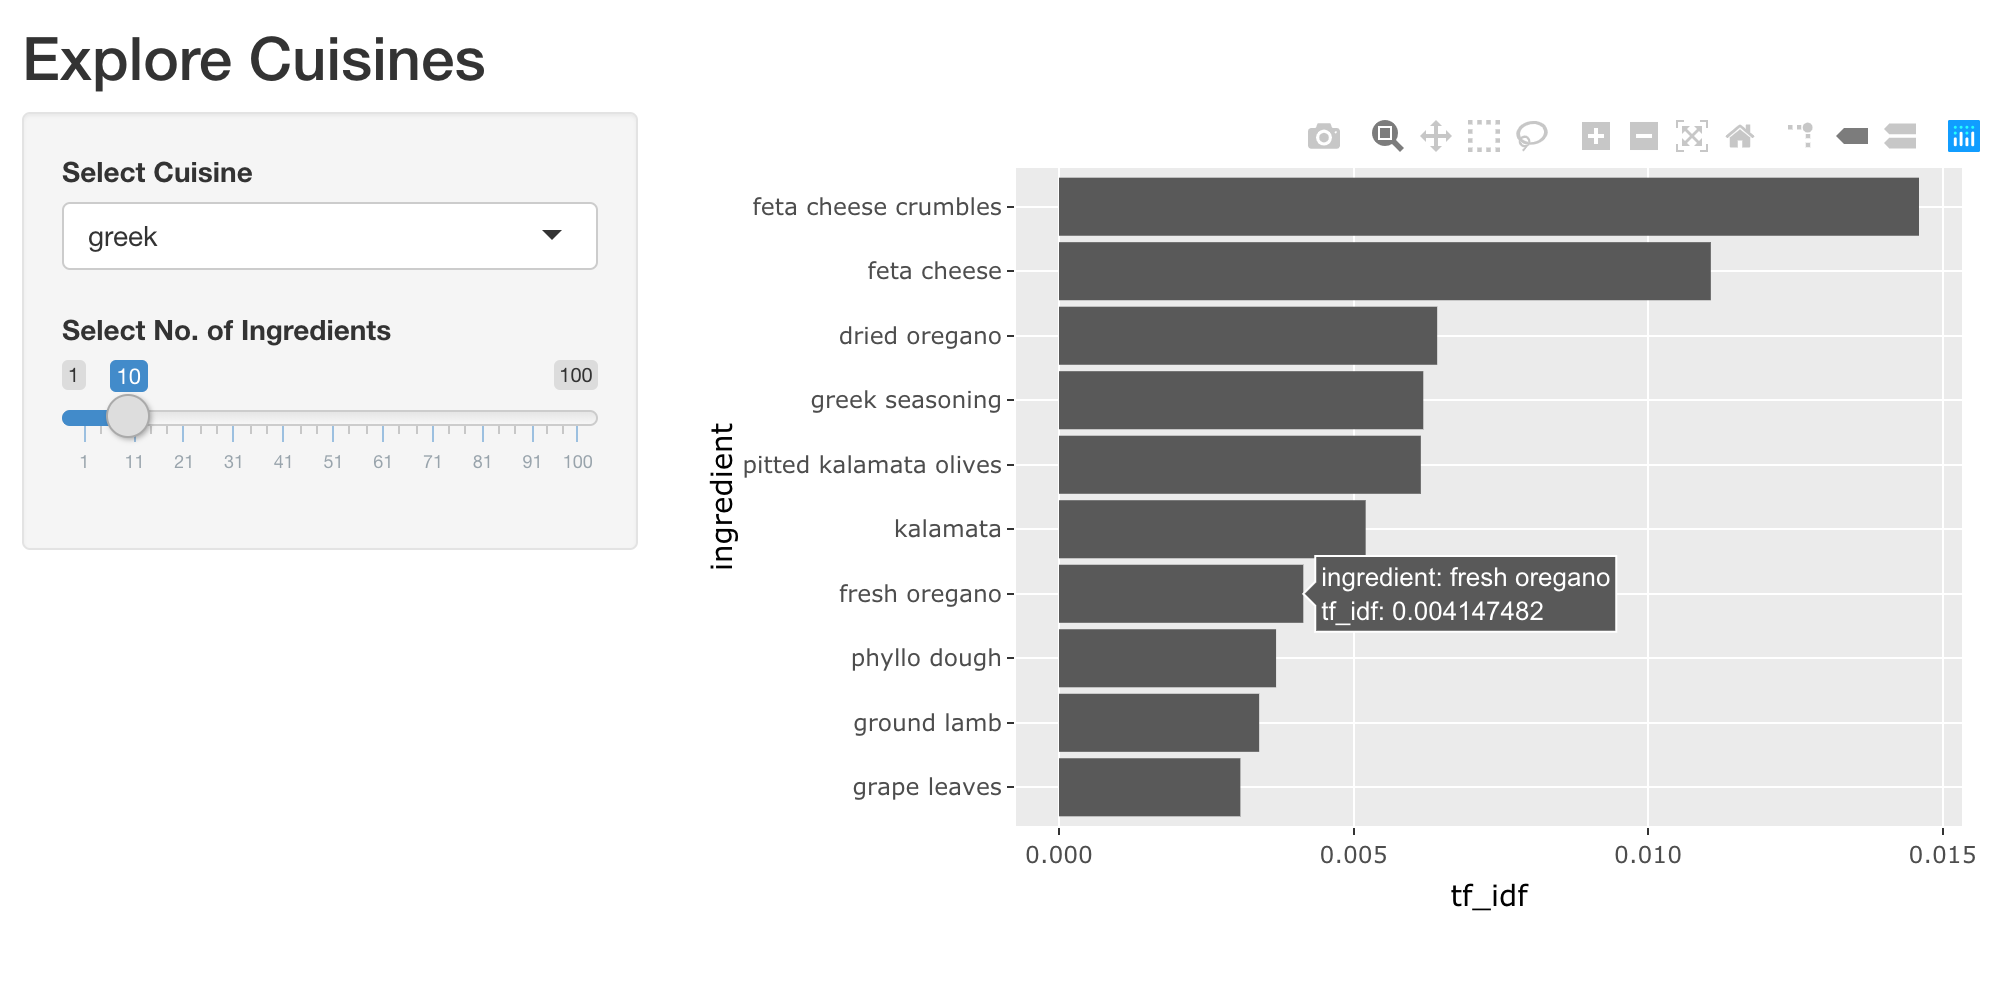
計算処理はリアクティブ式でカプセル化し、プロット部分は描画に専念させます。これは良いプログラミング実践で、モジュール性とパフォーマンスの高い Shiny アプリ作成に役立ちます。
shiny、dplyr、ggplot2、plotly パッケージは読み込んであります。以下は、料理別に上位の食材を抽出し、横棒グラフを作成するための便利なスニペットです。必要に応じて調整してください。
top_ingredients <- recipes_enriched %>%
  filter(cuisine == 'greek') %>%
  arrange(desc(tf_idf)) %>%
  head(5)

ggplot(top_ingredients, aes(x = ingredient, y = tf_idf)) +
  geom_col() +
  coord_flip()
この演習はコースの一部です
Rで作るShiny Webアプリケーション
演習の手順
UI:
plot_top_ingredientsという名前の対話的な plotly 出力を追加し、 適切なラベルを付けたtabPanel()に入れてください。
Server:
rval_top_ingredientsという名前のリアクティブ式を追加し、 選択された料理でrecipes_enrichedをフィルタし、tf_idfに基づく 特徴的な上位食材を抽出します。- 上位食材とその
tf_idfの対話的な棒グラフを描画し、plot_top_ingredientsという名前の出力に割り当ててください。 余力があれば、棒がtf_idfの降順で表示されるように並べ替えてみましょう。
実践的なインタラクティブ演習
このサンプルコードを完成させて、この演習に挑戦してみましょう。
ui <- fluidPage(
  titlePanel('Explore Cuisines'),
  sidebarLayout(
    sidebarPanel(
      selectInput('cuisine', 'Select Cuisine', unique(recipes$cuisine)),
      sliderInput('nb_ingredients', 'Select No. of Ingredients', 1, 100, 10),
    ),
    mainPanel(
      tabsetPanel(
        # CODE BELOW: Add a plotly output named "plot_top_ingredients"

        tabPanel('Table', DT::DTOutput('dt_top_ingredients'))
      )
    )
  )
)

server <- function(input, output, session) {
  # CODE BELOW: Add a reactive expression named `rval_top_ingredients` that
  # filters `recipes_enriched` for the selected cuisine and top ingredients
  # based on the tf_idf value.


  # CODE BELOW: Render a horizontal bar plot of top ingredients and
  # the tf_idf of recipes they get used in, and assign it to an output named
  # `plot_top_ingredients`


  output$dt_top_ingredients <- DT::renderDT({
    recipes %>%
      filter(cuisine == input$cuisine) %>%
      count(ingredient, name = 'nb_recipes') %>%
      arrange(desc(nb_recipes)) %>%
      head(input$nb_ingredients)
  })
}

shinyApp(ui, server)