銃乱射事件:入力を追加する
米国では銃乱射事件(Mass Shootings)が大きな議論の的になっています。 非営利団体の Mother Jones が、1982年以降の銃乱射事件の公開データベースを提供しています。これからの3つの演習で、これらの事件をインタラクティブな地図で探索する Shiny アプリを作成します。
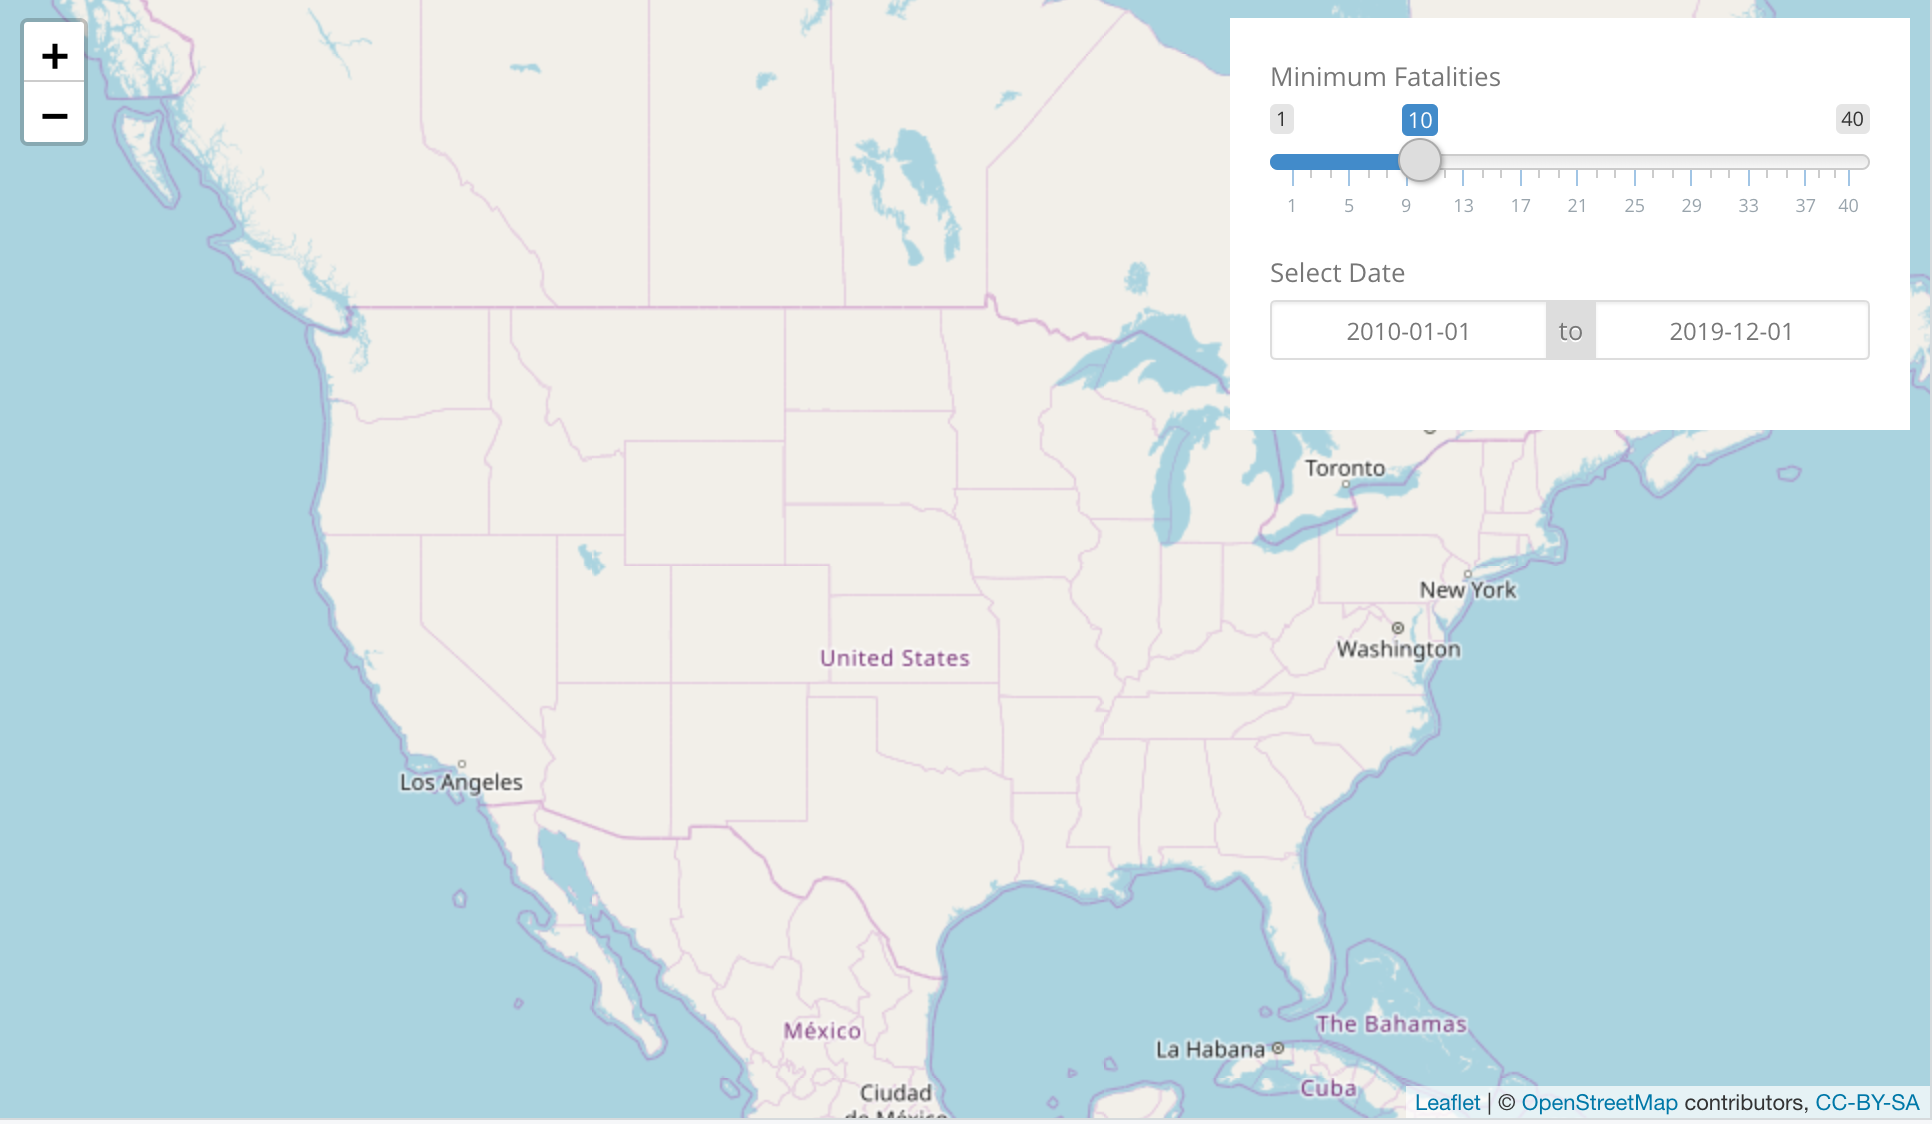
この演習では、fatalities を基準に絞り込むスライダー入力と、日付範囲で絞り込む日付レンジ入力を追加します。完成したアプリは、次のスクリーンショットのようになります。
データセット mass_shootings と、パッケージ shiny、dplyr、leaflet はすでに読み込まれています。
この演習はコースの一部です
Rで作るShiny Webアプリケーション
演習の手順
- データセット
mass_shootingsを死亡者数で絞り込むため、nb_fatalitiesという名前のスライダー入力を追加します。 - 日付範囲で絞り込むため、
date_rangeという名前の日付レンジ入力を追加します。
実践的なインタラクティブ演習
このサンプルコードを完成させて、この演習に挑戦してみましょう。
ui <- bootstrapPage(
  theme = shinythemes::shinytheme('simplex'),
  leaflet::leafletOutput('map', height = '100%', width = '100%'),
  absolutePanel(top = 10, right = 10, id = 'controls',
    # CODE BELOW: Add slider input named nb_fatalities

    # CODE BELOW: Add date range input named date_range

  ),
  tags$style(type = "text/css", "
    html, body {width:100%;height:100%}
    #controls{background-color:white;padding:20px;}
  ")
)

server <- function(input, output, session) {
  output$map <- leaflet::renderLeaflet({
    leaflet() %>%
      addTiles() %>%
      setView( -98.58, 39.82, zoom = 5) %>%
      addTiles()
  })
}

shinyApp(ui, server)