stripplot() dan swarmplot()
Banyak himpunan data memiliki data kategorikal dan Seaborn mendukung beberapa jenis plot yang berguna untuk data tersebut. Pada contoh ini, Anda akan melanjutkan meninjau data School Improvement tahun 2010 dan membagi himpunan data berdasarkan jenis model perbaikan sekolah yang digunakan.
Sebagai pengingat, berikut adalah distribusi KDE dari Award Amounts:
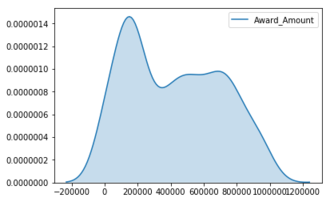
Meskipun plot ini berguna, masih banyak yang dapat Anda pelajari dengan melihat setiap Award_Amount dan bagaimana
jumlah tersebut terdistribusi di antara keempat kategori.
Latihan ini merupakan bagian dari kursus
Visualisasi Data Lanjutan dengan Seaborn
Latihan interaktif langsung praktik
Cobalah latihan ini dengan melengkapi kode contoh ini.
# Create the stripplot
sns.____(data=df,
         x='____',
         y='____',
         jitter=____)

plt.show()