ओशिनोग्राफी में लीनियर मॉडल
टाइम-सीरीज़ डेटा में, लीनियर मॉडल की "slope" किसी "rate-of-change" को दर्शाती है.
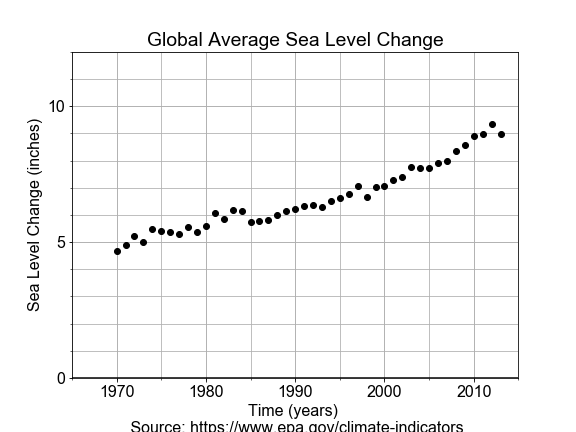
इस अभ्यास में, आप 1970 से 2010 तक के sea level change के माप का उपयोग करेंगे, बदलते sea level का एक लीनियर मॉडल बनाएँगे और भविष्य के sea level rise के बारे में एक प्रेडिक्शन करेंगे.
यह अभ्यास पाठ्यक्रम का हिस्सा है
Python में Linear Modeling परिचय
अभ्यास निर्देश
LinearRegression(fit_intercept=True)इम्पोर्ट करें और उसका उपयोग करके एक लीनियर मॉडल इनिशियलाइज़ करें.- प्रीलोडेड और reshaped
yearsतथाlevelsडेटा कोmodel.fit()में पास करें ताकि मॉडल फिट हो जाए. model.predict()का उपयोग करकेfuture_year = 2100के लिए एकलfuture_levelप्रेडिक्ट करें और परिणामprint()करें.model.predict()का उपयोग करके कईlevels_forecastका फोरकास्ट करें और प्री-डिफाइंडplot_data_and_forecast()के साथ परिणाम प्लॉट करें.
इंटरैक्टिव व्यावहारिक अभ्यास
इस अभ्यास को इस नमूना कोड को पूरा करके आज़माएँ।
# Import LinearRegression class, build a model, fit to the data
from sklearn.linear_model import ____
model = ____(fit_intercept=True)
model.fit(years, levels)

# Use model to make a prediction for one year, 2100
future_year = np.array(2100).reshape(1, -1)
future_level = model.predict(____)
print("Prediction: year = {}, level = {:.02f}".format(future_year, future_level[0,0]))

# Use model to predict for many years, and over-plot with measured data
years_forecast = np.linspace(1970, 2100, 131).reshape(-1, 1)
levels_forecast = model.predict(____)
fig = plot_data_and_forecast(years, levels, ____, ____)