गति और विश्वास-स्तर का आकलन
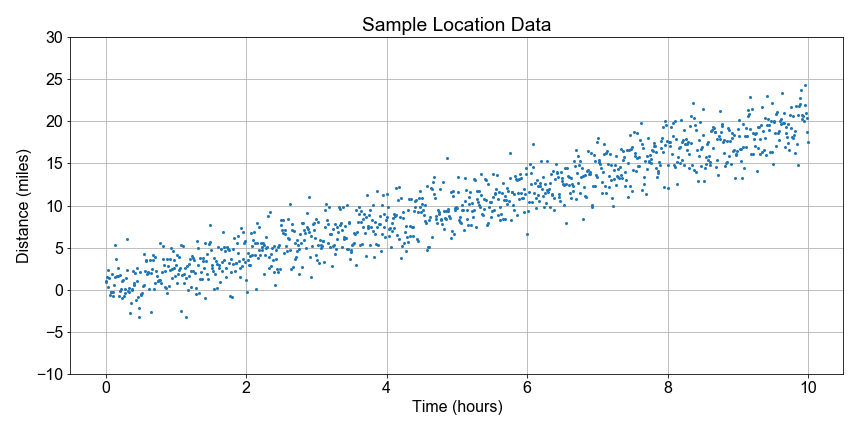
चलिए National Park की hiking डेटा को आगे देखते हैं. ध्यान दें कि कुछ दूरी नकारात्मक हैं क्योंकि वे trail head के विपरीत दिशा में चले; डेटा थोड़े messy हैं, इसलिए फिलहाल हम सिर्फ समग्र रुझान पर ध्यान देंगे.
इस अभ्यास में, आपका लक्ष्य boot-strap resampling का उपयोग करके किसी linear model के लिए speed मानों का वितरण खोजना है, और फिर उसी वितरण से speed का best estimate तथा उस estimate का 90% confidence interval निकालना है. यहाँ speed, linear regression मॉडल का slope पैरामीटर है जो time के फ़ंक्शन के रूप में distance को फिट करता है.
शुरू करने के लिए, हमने distance और time डेटा पहले से लोड कर दिए हैं, साथ में एक pre-defined least_squares() फंक्शन भी है जो हर resample के लिए speed मान निकालता है.
यह अभ्यास पाठ्यक्रम का हिस्सा है
Python में Linear Modeling परिचय
अभ्यास निर्देश
np.random.choice()का उपयोग करकेpopulation_indsसेsample_indsड्रॉ करें, ताकि हर डेटा बिंदु की distance-time जोड़ी बनी रहे.- time का क्रम बनाए रखने के लिए
sample_indsपर.sort()चलाएँ, और फिरsample_indsका उपयोग करकेdistancesऔरtimesको इंडेक्स करें. least_squares(times, distances)का उपयोग करके linear model के पैरामीटर निकालें औरa1कोresample_speedsमें स्टोर करें.resample_speedsपरnp.mean()औरnp.percentiles()लागू करें, speed और confidence intervalci_90निकालें, और फिर दोनों को प्रिंट करें.
इंटरैक्टिव व्यावहारिक अभ्यास
इस अभ्यास को इस नमूना कोड को पूरा करके आज़माएँ।
# Resample each preloaded population, and compute speed distribution
population_inds = np.arange(0, 99, dtype=int)
for nr in range(num_resamples):
    sample_inds = np.random.choice(____, size=100, replace=True)
    sample_inds.____()
    sample_distances = distances[____]
    sample_times = times[____]
    a0, a1 = ____(sample_times, sample_distances)
    resample_speeds[nr] = ____

# Compute effect size and confidence interval, and print
speed_estimate = np.mean(____)
ci_90 = np.percentile(____, [5, 95])
print('Speed Estimate = {:0.2f}, 90% Confidence Interval: {:0.2f}, {:0.2f} '.format(____, ____[0], ____[1]))