दो हिस्सों में variation
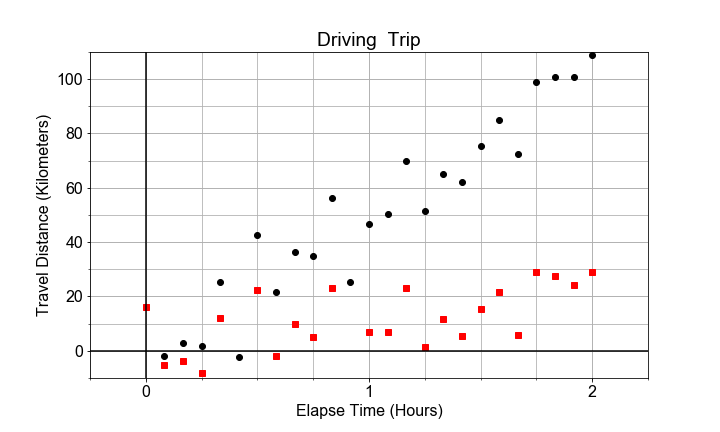
दो distance-versus-time डेटासेट दिए गए हैं: एक में वेग बहुत छोटा है और दूसरे में बड़ा. ध्यान दें कि दोनों में ढाल (slope) का standard error समान हो सकता है, लेकिन मॉडल के समग्र R-squared अलग हो सकते हैं. यह ढाल के आकार ("effect size") की तुलना standard error ("uncertainty") से कैसे होती है, उस पर निर्भर करता है.
यदि हम दोनों डेटासेट को एक ही axes पर scatter plots की तरह प्लॉट करें, तो अंतर साफ दिखता है. ढाल के कारण होने वाला variation, ट्रेंड लाइन के इर्द-गिर्द random scatter के कारण होने वाले variation से अलग होता है. इस अभ्यास में, आपका लक्ष्य दोनों डेटासेट के लिए standard error और R-squared निकालना और उनकी तुलना करना है.
यह अभ्यास पाठ्यक्रम का हिस्सा है
Python में Linear Modeling परिचय
अभ्यास निर्देश
- दोनों डेटासेट
distances1औरdistances2के लिएols()मॉडल बनाएँ औरfit()करें. - प्राप्त मॉडलों
model_1औरmodel_2की.bseऔर'times'key का उपयोग करके, प्रत्येक मॉडल से ढाल का standard error निकालें. .rsquaredattribute का उपयोग करके प्रत्येक मॉडल का R-squared मान निकालें.- परिणामी
se_1,rsquared_1,se_2,rsquared_2प्रिंट करें और विजुअली तुलना करें.
इंटरैक्टिव व्यावहारिक अभ्यास
इस अभ्यास को इस नमूना कोड को पूरा करके आज़माएँ।
# Build and fit two models, for columns distances1 and distances2 in df
model_1 = ols(formula="____ ~ times", data=df).____()
model_2 = ols(formula="____ ~ times", data=df).____()

# Extract R-squared for each model, and the standard error for each slope
se_1 = model_1.____['times']
se_2 = model_2.____['times']
rsquared_1 = model_1.____
rsquared_2 = model_2.____

# Print the results
print('Model 1: SE = {:0.3f}, R-squared = {:0.3f}'.format(____, ____))
print('Model 2: SE = {:0.3f}, R-squared = {:0.3f}'.format(____, ____))