Interprétation des predictor insight graphs
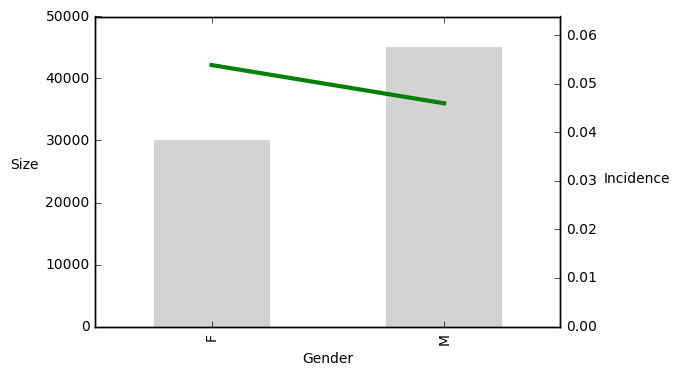
Considérez le predictor insight graph qui montre la relation entre l’incidence de la cible et le genre (M - homme, F - femme) du donateur potentiel. Les barres indiquent la taille des groupes, la ligne indique le pourcentage de cibles.
Cet exercice fait partie du cours
<cours>Introduction à l’analytique prédictive en Python</cours>Exercice interactif pratique
Transformez la théorie en action avec l’un de nos exercices interactifs
 Commencer l’exercice