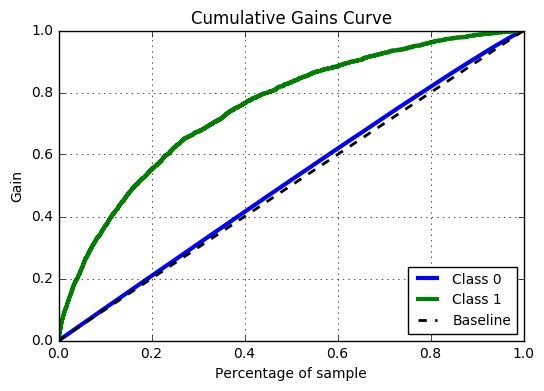
Interpréter la courbe des gains cumulés
Vous avez construit un modèle pour prédire quels donateurs ont le plus de chances de répondre à une campagne et tracé une courbe des gains cumulés ci-dessous. Supposons que vous avez le budget pour envoyer une lettre aux 30 000 meilleurs donateurs sur 100 000. Combien de cibles (donateurs qui répondent) aurez-vous atteintes, s’il y a 5 000 cibles parmi les 100 000 donateurs ? Rappelez-vous que la courbe des gains cumulés indique, pour chaque valeur x de l’axe horizontal, le pourcentage de cibles atteint en utilisant le modèle.
Cet exercice fait partie du cours
<cours>Introduction à l’analytique prédictive en Python</cours>Exercice interactif pratique
Transformez la théorie en action avec l’un de nos exercices interactifs
 Commencer l’exercice