Comprendre les tableaux de contingence
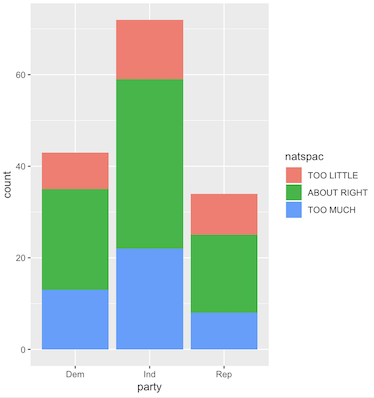
Le diagramme en barres des effectifs que vous avez construit est une représentation visuelle d’un tableau de contingence.
Laquelle des affirmations suivantes est FAUSSE au sujet des tableaux de contingence ?
Cet exercice fait partie du cours
<cours>Inférence pour des données catégorielles en R</cours>Exercice interactif pratique
Transformez la théorie en action avec l’un de nos exercices interactifs
 Commencer l’exercice