Distribuciones de train/test
En una entrevista de Machine Learning, casi seguro trabajarás con datos de entrenamiento y de prueba. Como vimos antes, el rendimiento del modelo puede empeorar si las distribuciones de los conjuntos de entrenamiento y prueba difieren.
En este ejercicio, usarás funciones de sklearn.model_selection, además de seaborn y matplotlib.pyplot, para dividir loan_data en un conjunto de entrenamiento y otro de prueba, y visualizar sus distribuciones para detectar posibles discrepancias.
Ten en cuenta que seaborn y matplotlib.pyplot ya se han importado en tu espacio de trabajo con los alias sns y plt, respectivamente.
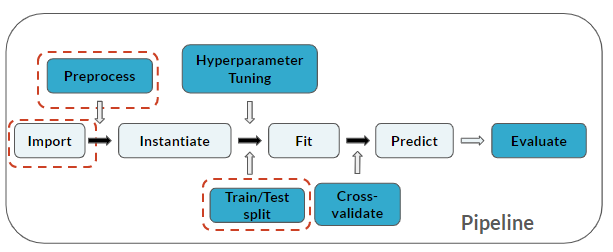
La canalización ahora incluye Train/Test split:
Este ejercicio forma parte del curso
Practicing Machine Learning Interview Questions in Python
Instrucciones del ejercicio
- Filtra
loan_datapara quedarte solo con las característicasCredit ScoreyAnnual Income, y la variable objetivoLoan Statusen ese orden. - Crea una división 80/20 de
loan_datay asígnala aloan_data_subset. - Crea pairplots de
trainingSetytestSet(en ese orden) estableciendo el argumentohueen la variable objetivoLoan Status.
ejercicio interactivo práctico
Prueba este ejercicio completando este código de ejemplo.
# Create `loan_data` subset: loan_data_subset
loan_data_subset = ____[['____','____','____']]

# Create train and test sets
trainingSet, testSet = ____(____, ____=___, random_state=123)

# Examine pairplots
plt.figure()
sns.____(____, hue='____', palette='RdBu')
plt.show()

plt.figure()
sns.____(____, hue='____', palette='RdBu')
plt.show()