Detección de valores atípicos
Un aspecto muy importante del preprocesamiento correcto de tus datos es la detección de valores atípicos. En entrevistas de Machine Learning, es habitual que te pregunten cómo localizar y tratar los valores atípicos. Una forma sencilla de detectarlos es visualizándolos gráficamente.
Tras encontrar e imputar los datos ausentes, identificar y decidir qué hacer con los valores atípicos es otro paso necesario de preprocesamiento.
Hay muchos paquetes que te permiten visualizar valores atípicos, pero en este ejercicio usarás seaborn para trazar diagramas de caja univariantes y multivariantes de columnas seleccionadas de loan_data.
Todos los paquetes relevantes ya se han importado por ti.
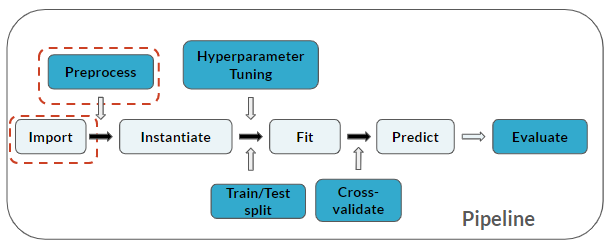
¿En qué punto estás del pipeline?
Este ejercicio forma parte del curso
Practicing Machine Learning Interview Questions in Python
ejercicio interactivo práctico
Prueba este ejercicio completando este código de ejemplo.
# Import modules
import matplotlib.pyplot as plt
import seaborn as sns

# Univariate and multivariate boxplots
fig, ax =plt.subplots(1,2)
sns.____(y=____['_____'], ax=ax[0])
sns.____(x='Loan Status', y='Annual Income', data=____, ax=ax[1])
plt.show()