Interpreting dendrogram
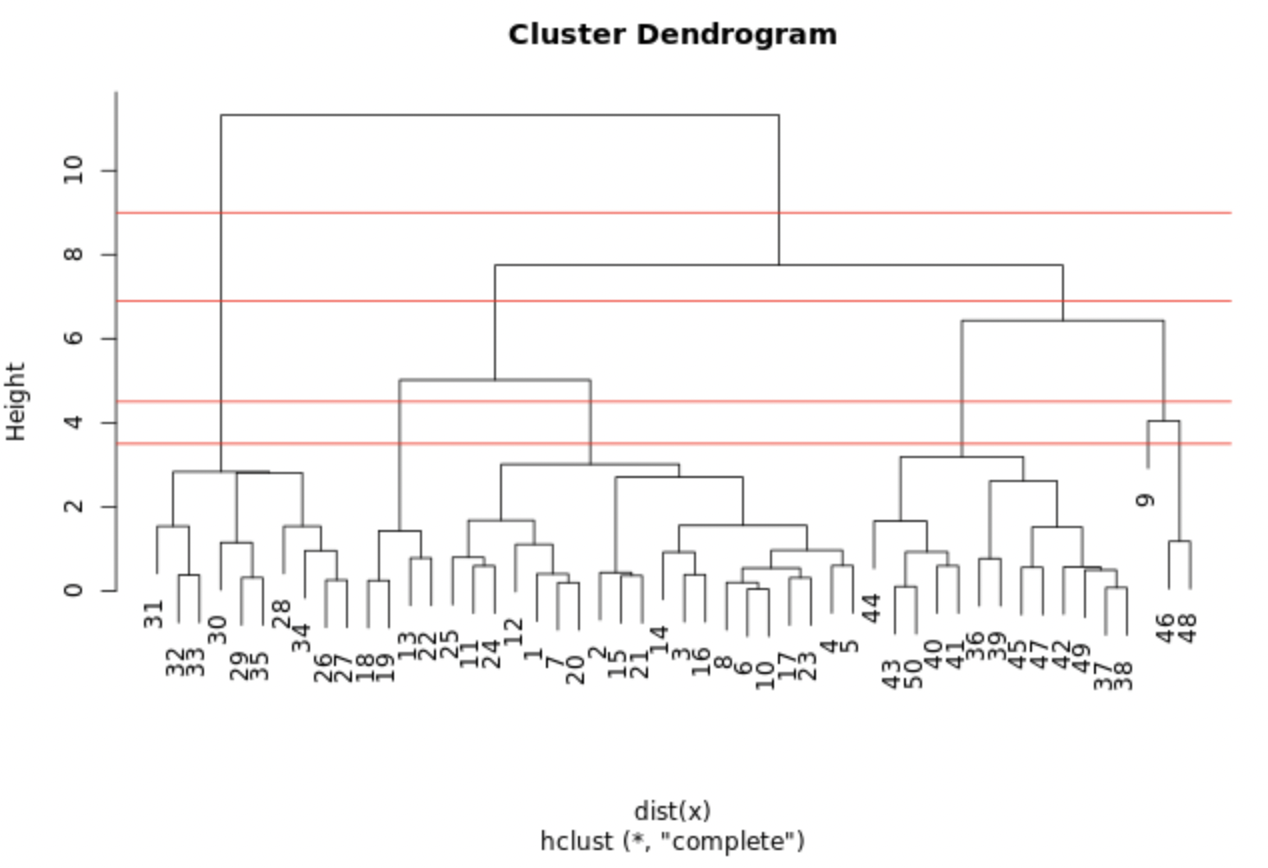
The plot displayed shows the hclust.out model you constructed in the previous exercise. We've drawn horizontal lines at heights of 3.5, 4.5, 6.9, and 9.0, respectively.
Which cut point yields 3 clusters?
Diese Übung ist Teil des Kurses
<Kurs>Unsupervised Learning in R</Kurs>Interaktive praktische Übung
Verwandle Theorie mit einer unserer interaktiven Übungen in die Praxis
 Übung starten