計算期望的計數數量
在前面的練習中,你已經計算過螃蟹資料的平均與變異,並判定兩者不相等。這個練習要用已計算出的平均值,針對特定的計數值(例如 0 次),計算該值的「期望計數數量」,作為檢視過度離散的另一種分析方式。換句話說,給定樣本的計數平均,我們應該在樣本中期待看到多少個「衛星數為 0」的螃蟹。
回想 crab 資料集的圖形,你會注意到有大量的 0 次計數。
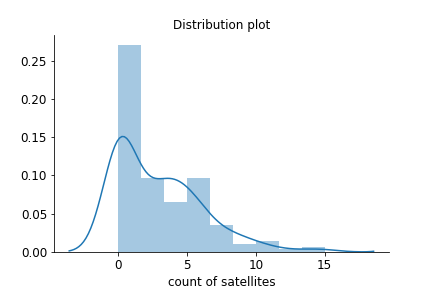
回顧:若要在已知參數下計算某一計數的期望數量,可以使用定義好的卜瓦松(Poisson)分配:
$$ P(y)=\frac{\lambda^y e^{-\lambda}}{y!} $$
工作區已預先載入 crab 資料集與已計算的平均值 sat_mean。
本練習屬於課程
Generalized Linear Models in Python
練習說明
- 使用已計算的平均
sat_mean與零計數 $y = 0$,計算期望的 0 次計數數量。請使用math的factorial()。 - 使用
sum()計算sat變數中 0 次計數的觀測數量,並用len()取得樣本的總觀測數。 - 印出實際 0 次計數觀測數量與總觀測數的比值。
動手互動練習
試著完成這個範例程式碼,體驗一下這個練習。
# Expected number of zero counts
exp_zero_cnt = ((____**____)*np.____(-____))/math.____(____)

# Print exp_zero_counts
print('Expected zero counts given mean of ', round(____,3),
      'is ', round(____,3)*100)

# Number of zero counts in sat variable
actual_zero_cnt = sum(____[____]  == 0)

# Number of observations in crab dataset
num_obs = len(____)

# Print the percentage of zero count observations in the sample
print('Actual zero counts in the sample: ', round(____ / ____,3)*100)