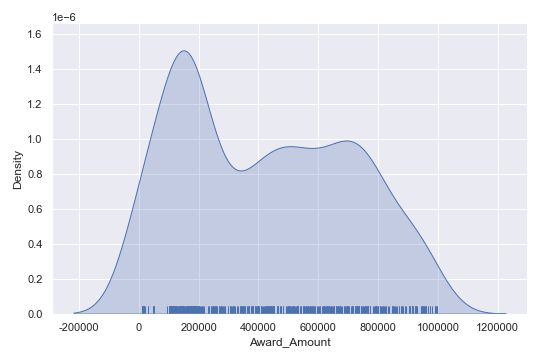
Interpreting the results
Looking at this displot, which of these choices can you infer based on the visualization?
Bu egzersiz, kursun bir parçasıdır
Intermediate Data Visualization with Seaborn
Uygulamalı etkileşimli egzersiz
Teoriyi etkileşime dönüştürün, interaktif egzersizlerimizden biriyle
 Egzersize başla