Seaborn'ın çubuk grafiklerini düzeltmek
Seaborn'ın çubuk grafiklerdeki varsayılan çubuk renkleri, algısal doğruluk için ideal değildir. Her çubuğu farklı renkte çizdiğinde, izleyicinin aynı boyuttaki iki çubuğu farklı boyutlarda görmesi riski doğar; çünkü insanlar bazı renkleri diğerlerinden "daha büyük" görme eğilimindedir.
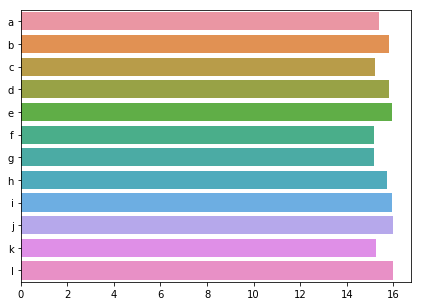
Bunu düzeltmenin iki kolay yolunu konuştuk. Birincisi, çubukların etrafına bir kenarlık eklemek; ikincisi, tüm çubuk renklerini aynı değere çevirmek. Her iki çözümü de kirlilik verilerimiz üzerinde dene.
Bu egzersiz, kursun bir parçasıdır
Python'da Veri Görselleştirmelerini İyileştirme
Uygulamalı etkileşimli egzersiz
Bu egzersizi bu örnek kodu tamamlayarak deneyin.
import numpy as np

sns.barplot(y = 'city', x = 'CO',
            estimator = np.mean,
            ci = False,
            data = pollution,
            # Add a border to the bars
            ____ = ____)
plt.show()