Non-linear logistic regression
In chapter 3, you explored the distance commuters traveled and the linear effect this had on the probability of somebody riding the bus. However, what if this relationship is non-linear and non-monotonic?
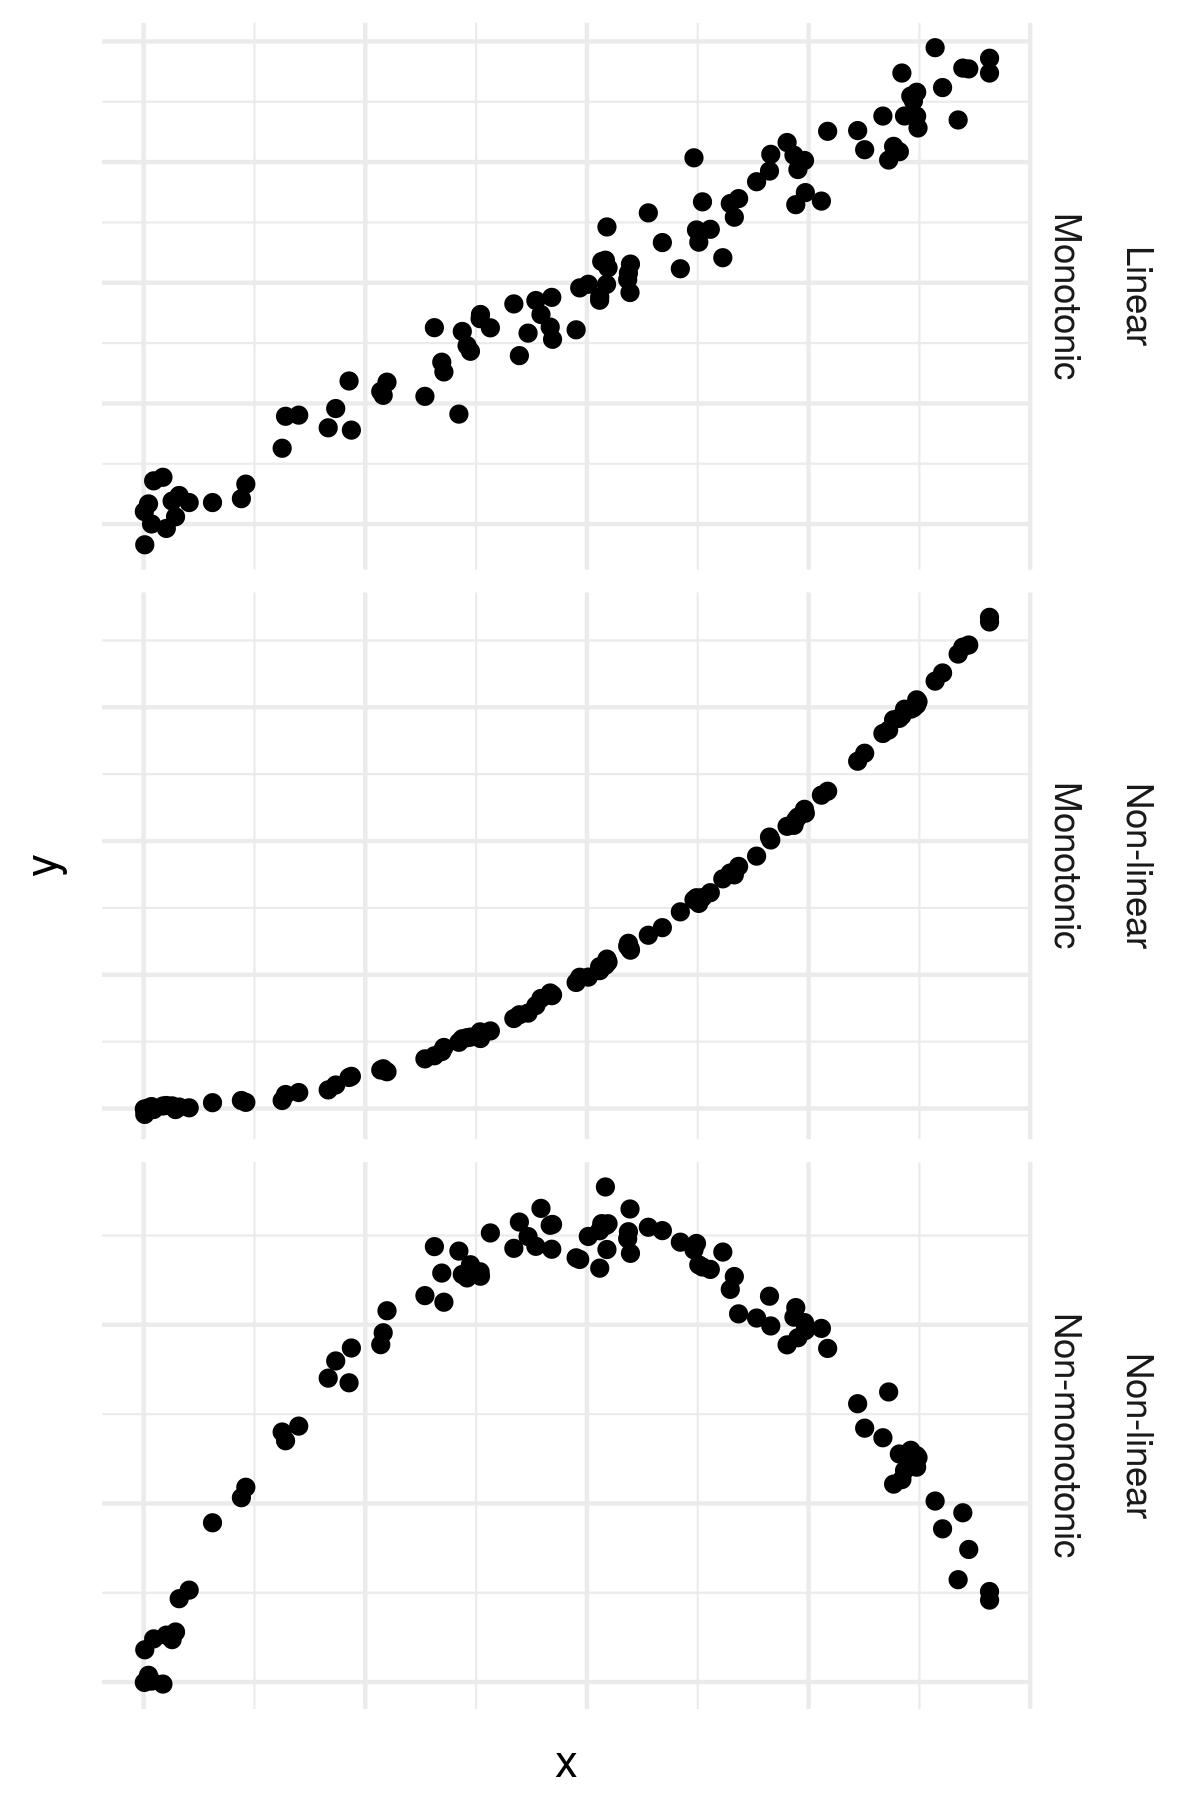
For example, what if people who commute the shortest distances and longest are less likely to ride the bus?
You can add non-linear terms to formulas in R using the I(..) function as part of your formula.
For example y~I(x^2) allows you to estimate a coefficient for x*x.
During this exercise, you will examine the bus data more.
Bu egzersiz, kursun bir parçasıdır
Generalized Linear Models in R
Egzersiz talimatları
- Add the formula
y ~ I(x^2)to theformulaoption in the second call togeom_smooth().
Uygulamalı etkileşimli egzersiz
Bu egzersizi bu örnek kodu tamamlayarak deneyin.
# Plot linear effect of travel distance on probability of taking the bus
gg_jitter <-
	ggplot(data = bus, aes(x = MilesOneWay, y = Bus2)) +
	geom_jitter(width = 0, height = 0.05) +
	geom_smooth(method = 'glm',
                method.args = list(family = 'binomial'))

# Add a non-linear equation to a geom_smooth()
gg_jitter +
	geom_smooth(method = 'glm',
                method.args = list(family = 'binomial'),
                formula = ___,
                color = 'red')