ICs e nível de confiança
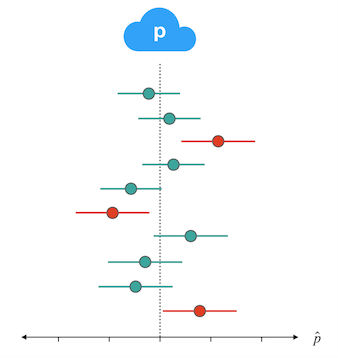
Aprendemos que, para um intervalo de confiança de 95% (um nível de confiança de 0,95), se tirarmos muitas amostras do mesmo tamanho e calcularmos muitos intervalos, esperaríamos que 95% dos intervalos resultantes contivessem o parâmetro. Com base no conjunto de intervalos de confiança plotados aqui, qual é o seu melhor palpite para o nível de confiança usado nesses intervalos?
Como no vídeo, a proporção populacional é representada pelo p na nuvem e pela linha pontilhada, e cada intervalo de confiança é representado por um segmento que se estende a partir do seu p-chapeu. Intervalos que capturam o valor verdadeiro estão em verde; os que não capturam estão em vermelho.
Este exercicio faz parte do curso
Inferência para Dados Categóricos em R
exercicio interativo prático
Transforme teoria em prática com um dos nossos exercicio interativos
 Iniciar exercicio