Entendendo tabelas de contingência
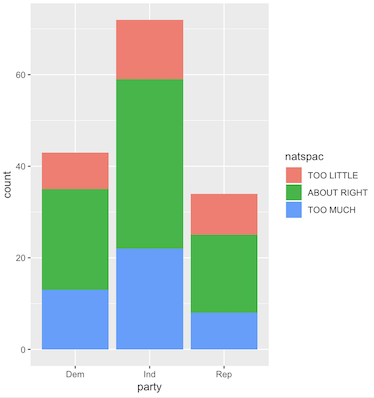
O gráfico de barras de contagens que você construiu é uma representação visual de uma tabela de contingência.
Qual das alternativas a seguir é FALSA sobre tabelas de contingência?
Este exercicio faz parte do curso
Inferência para Dados Categóricos em R
exercicio interativo prático
Transforme teoria em prática com um dos nossos exercicio interativos
 Iniciar exercicio