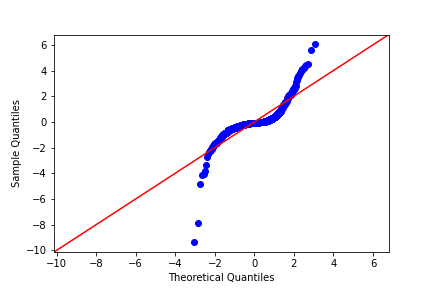
Q-Q plot of residuals
Here are normal Q-Q plots of the previous two models.
Original model (n_clicks versus n_impressions):
Transformed model (n_clicks ** 0.25 versus n_impressions ** 0.25):
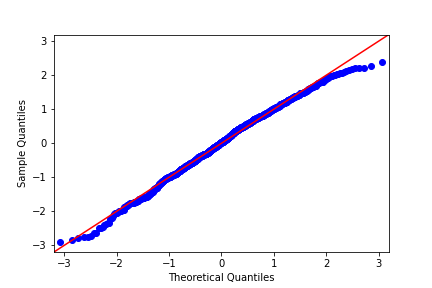
Look at how well the points track the "normality" line. Which statement is true?
Deze oefening maakt deel uit van de cursus
Introduction to Regression with statsmodels in Python
Praktische interactieve oefening
Zet theorie om in actie met een van onze interactieve oefeningen.
 Begin met trainen