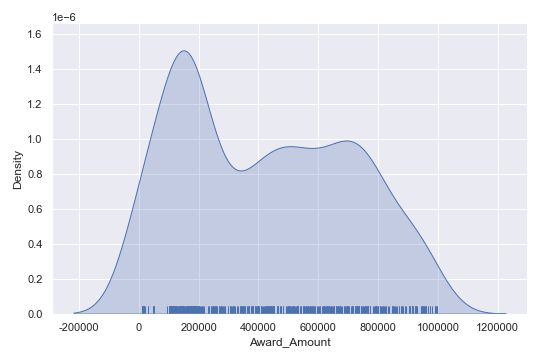
Interpreting the results
Looking at this displot, which of these choices can you infer based on the visualization?
Deze oefening maakt deel uit van de cursus
Intermediate Data Visualization with Seaborn
Interactieve oefening met praktijkervaring
Zet theorie om in actie met een van onze interactieve oefeningen
 Begin oefening