Mengeksplorasi himpunan data rambu lalu lintas
Untuk lebih memahami bagaimana fungsi knn() dapat mengklasifikasikan rambu stop, akan membantu jika Anda menelaah himpunan data pelatihan yang digunakan.
Setiap rambu jalan yang pernah diamati dibagi menjadi kisi 4x4, dan tingkat merah, hijau, serta biru untuk masing-masing dari 16 piksel tengah dicatat seperti yang diilustrasikan di sini.
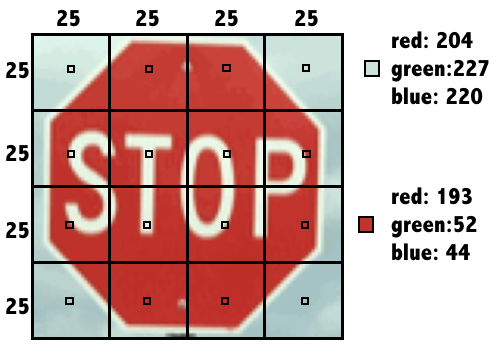
Hasilnya adalah himpunan data yang merekam sign_type serta 16 x 3 = 48 properti warna dari setiap rambu.
Latihan ini merupakan bagian dari kursus
Supervised Learning di R: Klasifikasi
Instruksi latihan
- Gunakan fungsi
str()untuk menelaah himpunan datasigns. - Gunakan
table()untuk menghitung jumlah observasi dari tiap jenis rambu dengan memberikan kolom yang berisi label. - Jalankan perintah
aggregate()yang disediakan untuk melihat apakah rata-rata tingkat merah mungkin berbeda menurut jenis rambu.
Latihan interaktif langsung praktik
Cobalah latihan ini dengan melengkapi kode contoh ini.
# Examine the structure of the signs dataset


# Count the number of signs of each type
table(___)

# Check r10's average red level by sign type
aggregate(r10 ~ sign_type, data = signs, mean)