Relational Neighbor Classifier
Dalam latihan ini, Anda akan menerapkan sebuah pengklasifikasi berbasis jaringan sederhana yang disebut relational neighbor classifier.
Pengklasifikasi ini menggunakan label kelas dari node tetangga untuk menghitung probabilitas churn bagi setiap node dalam jaringan.
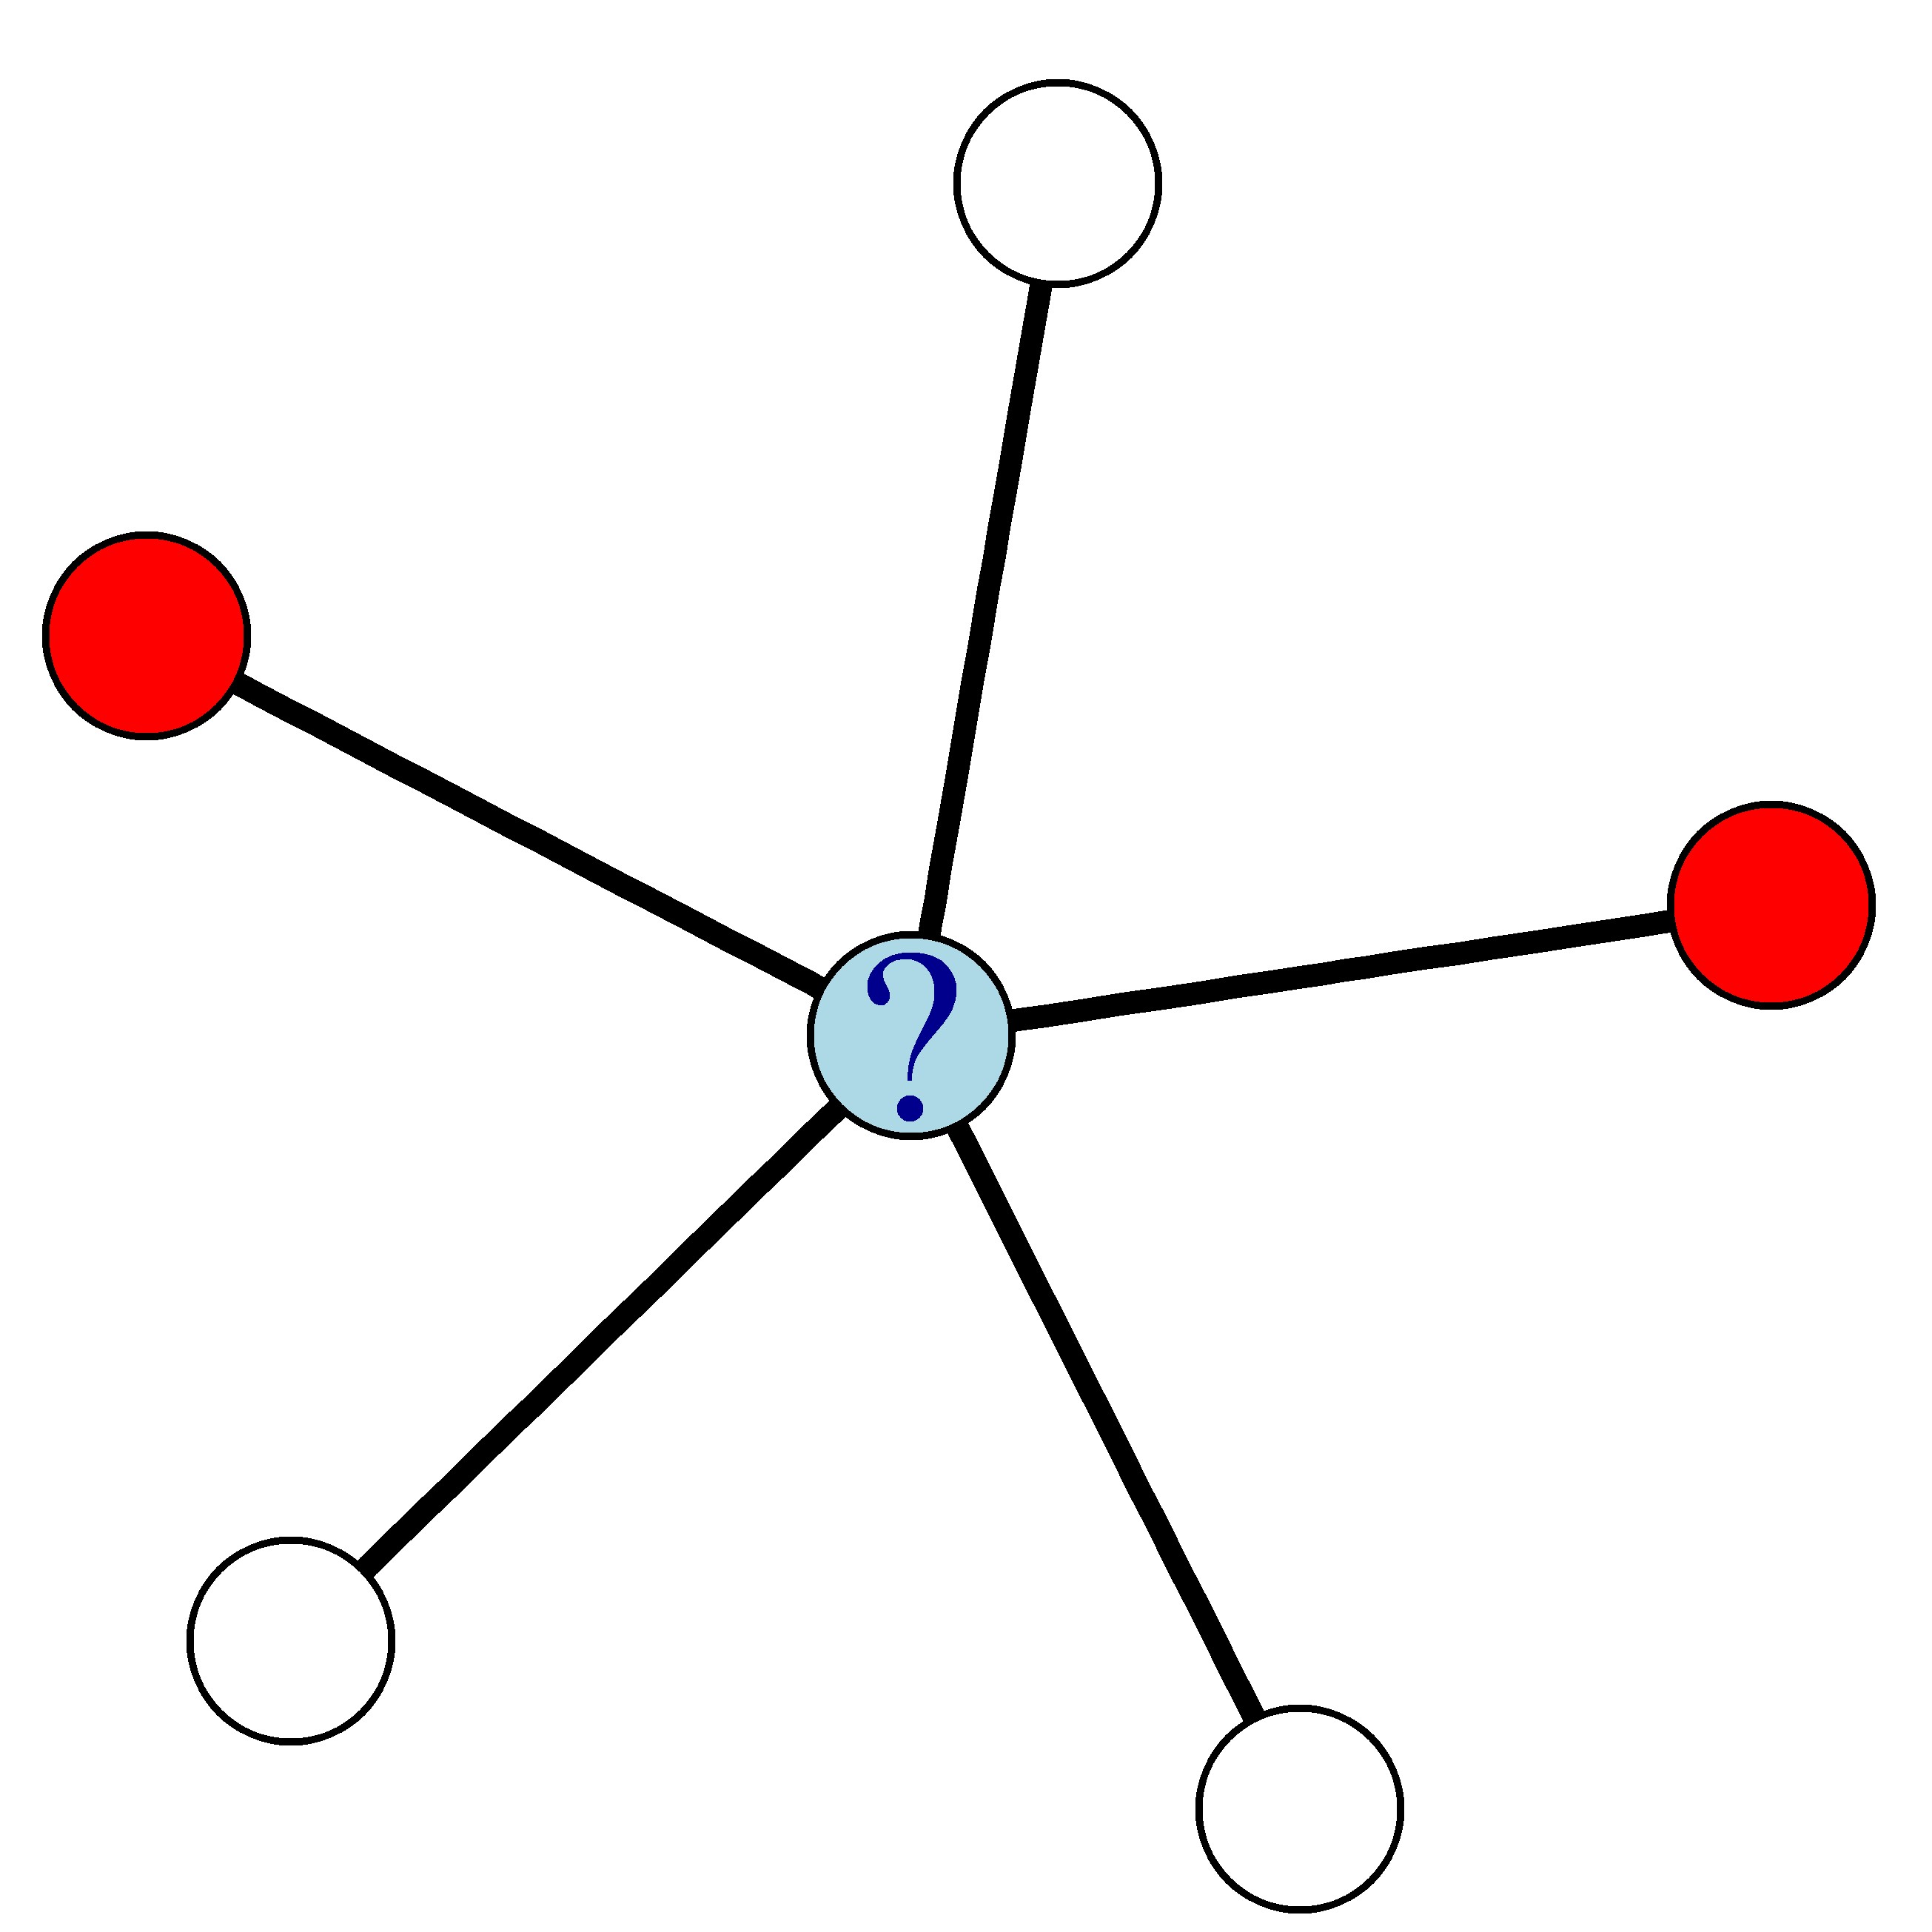
Sebagai contoh, pada jaringan di bawah ini, di mana node merah menandakan pelanggan yang churn dan node putih menandakan yang tidak churn, probabilitas churn untuk node biru adalah 0,4.
Anda diberikan dua vektor: ChurnNeighbors dan NonChurnNeighbors yang masing-masing berisi jumlah tetangga pelanggan yang churn dan tidak churn.
Latihan ini merupakan bagian dari kursus
Analitik Prediktif menggunakan Data Berjejaring di R
Instruksi latihan
- Hitung probabilitas churn setiap pelanggan,
churnProb, menggunakan relational neighbor classifier. - Gunakan
which()untuk menemukan pelanggan dengan probabilitas churn tertinggi. Sebut vektor inimostLikelyChurners. - Gunakan
mostLikelyChurnersuntuk menemukan ID pelanggan dengan probabilitas churn tertinggi.
Latihan interaktif langsung praktik
Cobalah latihan ini dengan melengkapi kode contoh ini.
# Compute the churn probabilities
churnProb <- ___ / (ChurnNeighbors + ___)

# Find who is most likely to churn
mostLikelyChurners <- which(churnProb == ___(churnProb))

# Extract the IDs of the most likely churners
customers$id[___]