Regresi logistik nonlinier
Pada bab 3, Anda menelusuri jarak yang ditempuh para komuter dan efek linear dari jarak tersebut terhadap probabilitas seseorang naik bus. Namun, bagaimana jika hubungan ini bersifat nonlinier dan nonmonotonik?
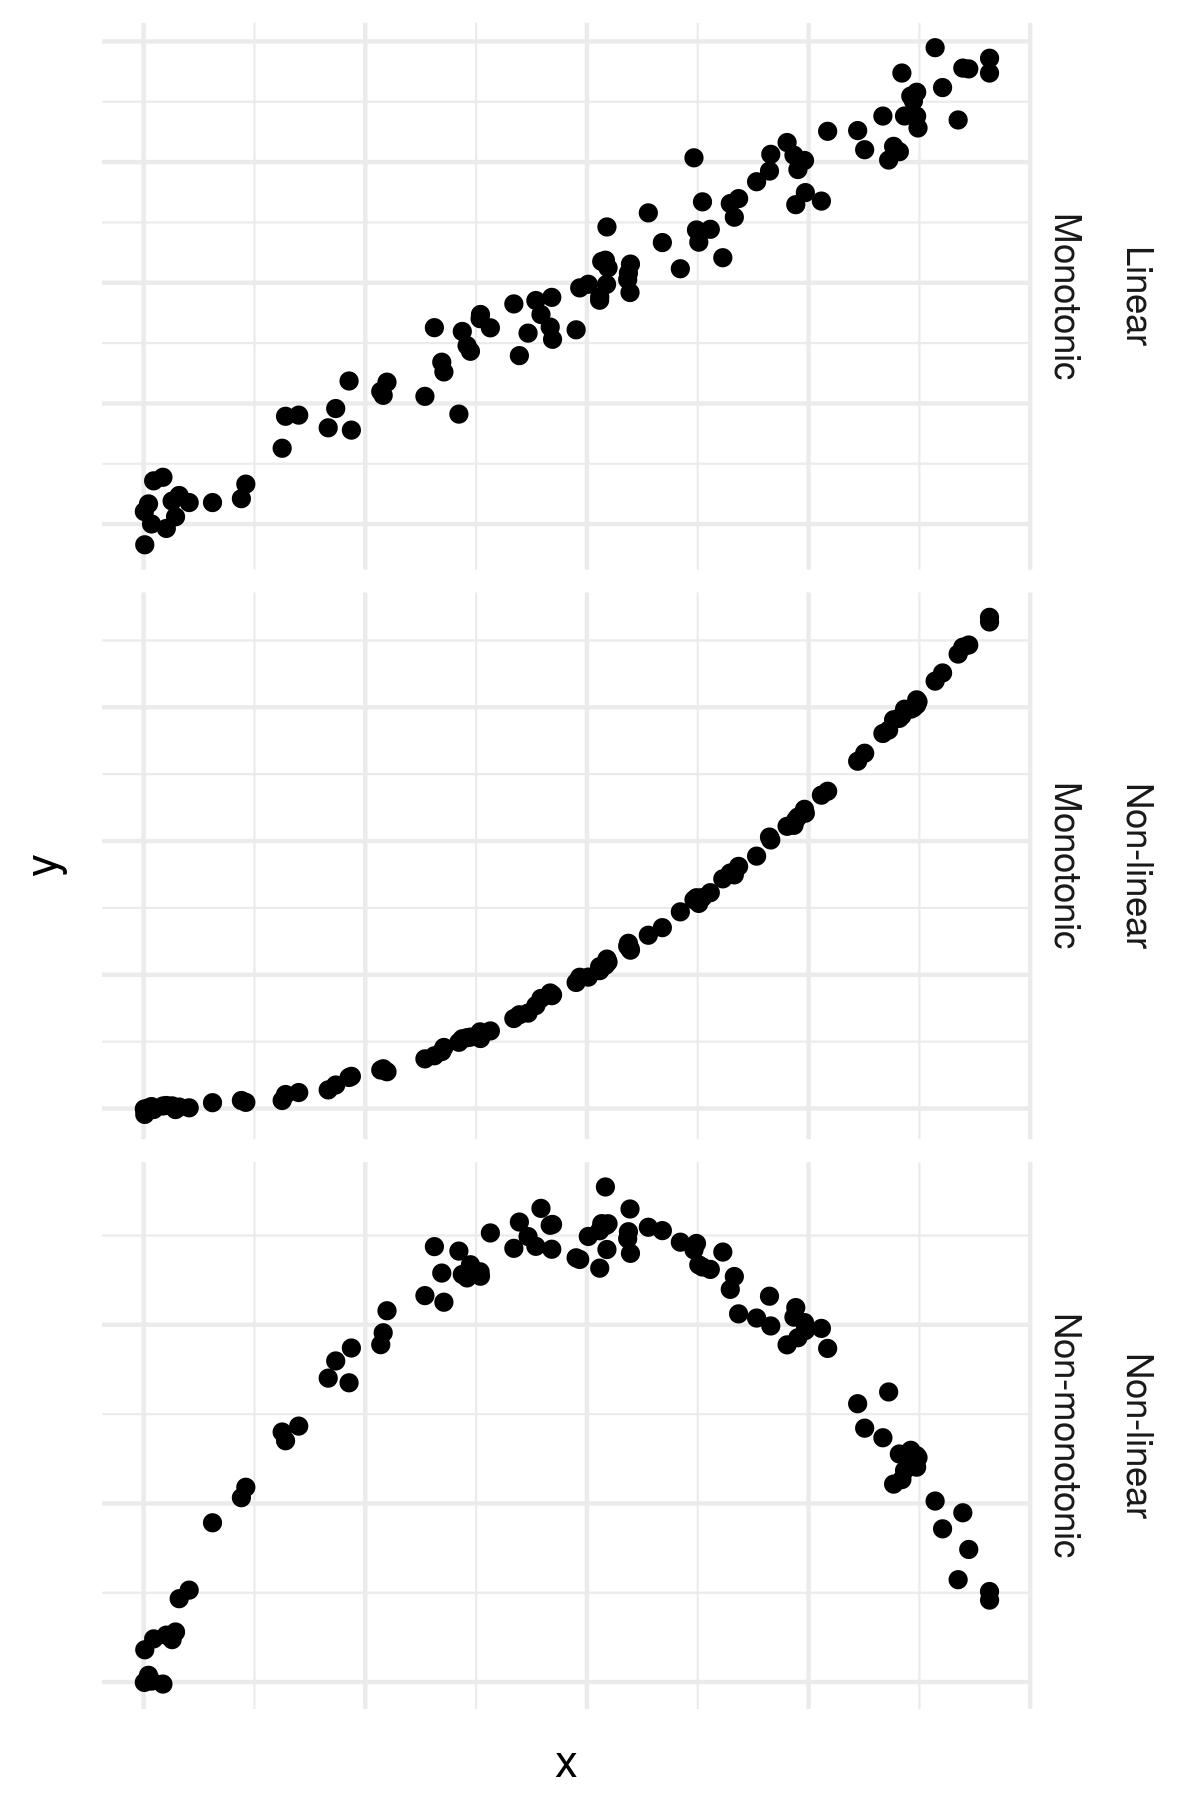
Sebagai contoh, bagaimana jika orang yang menempuh jarak terpendek dan terjauh justru lebih kecil kemungkinannya untuk naik bus?
Anda dapat menambahkan suku nonlinier ke formula di R menggunakan fungsi I(..) sebagai bagian dari formula.
Sebagai contoh, y~I(x^2) memungkinkan Anda mengestimasi koefisien untuk x*x.
Dalam latihan ini, Anda akan menelaah data bus lebih lanjut.
Latihan ini merupakan bagian dari kursus
Model Linear Tergeneralisasi di R
Instruksi latihan
- Tambahkan formula
y ~ I(x^2)ke opsiformulapada pemanggilangeom_smooth()yang kedua.
Latihan interaktif langsung praktik
Cobalah latihan ini dengan melengkapi kode contoh ini.
# Plot linear effect of travel distance on probability of taking the bus
gg_jitter <-
	ggplot(data = bus, aes(x = MilesOneWay, y = Bus2)) +
	geom_jitter(width = 0, height = 0.05) +
	geom_smooth(method = 'glm',
                method.args = list(family = 'binomial'))

# Add a non-linear equation to a geom_smooth()
gg_jitter +
	geom_smooth(method = 'glm',
                method.args = list(family = 'binomial'),
                formula = ___,
                color = 'red')