Classifieur des voisins relationnels
Dans cet exercice, vous allez appliquer un classifieur simple basé sur le réseau, appelé classifieur des voisins relationnels.
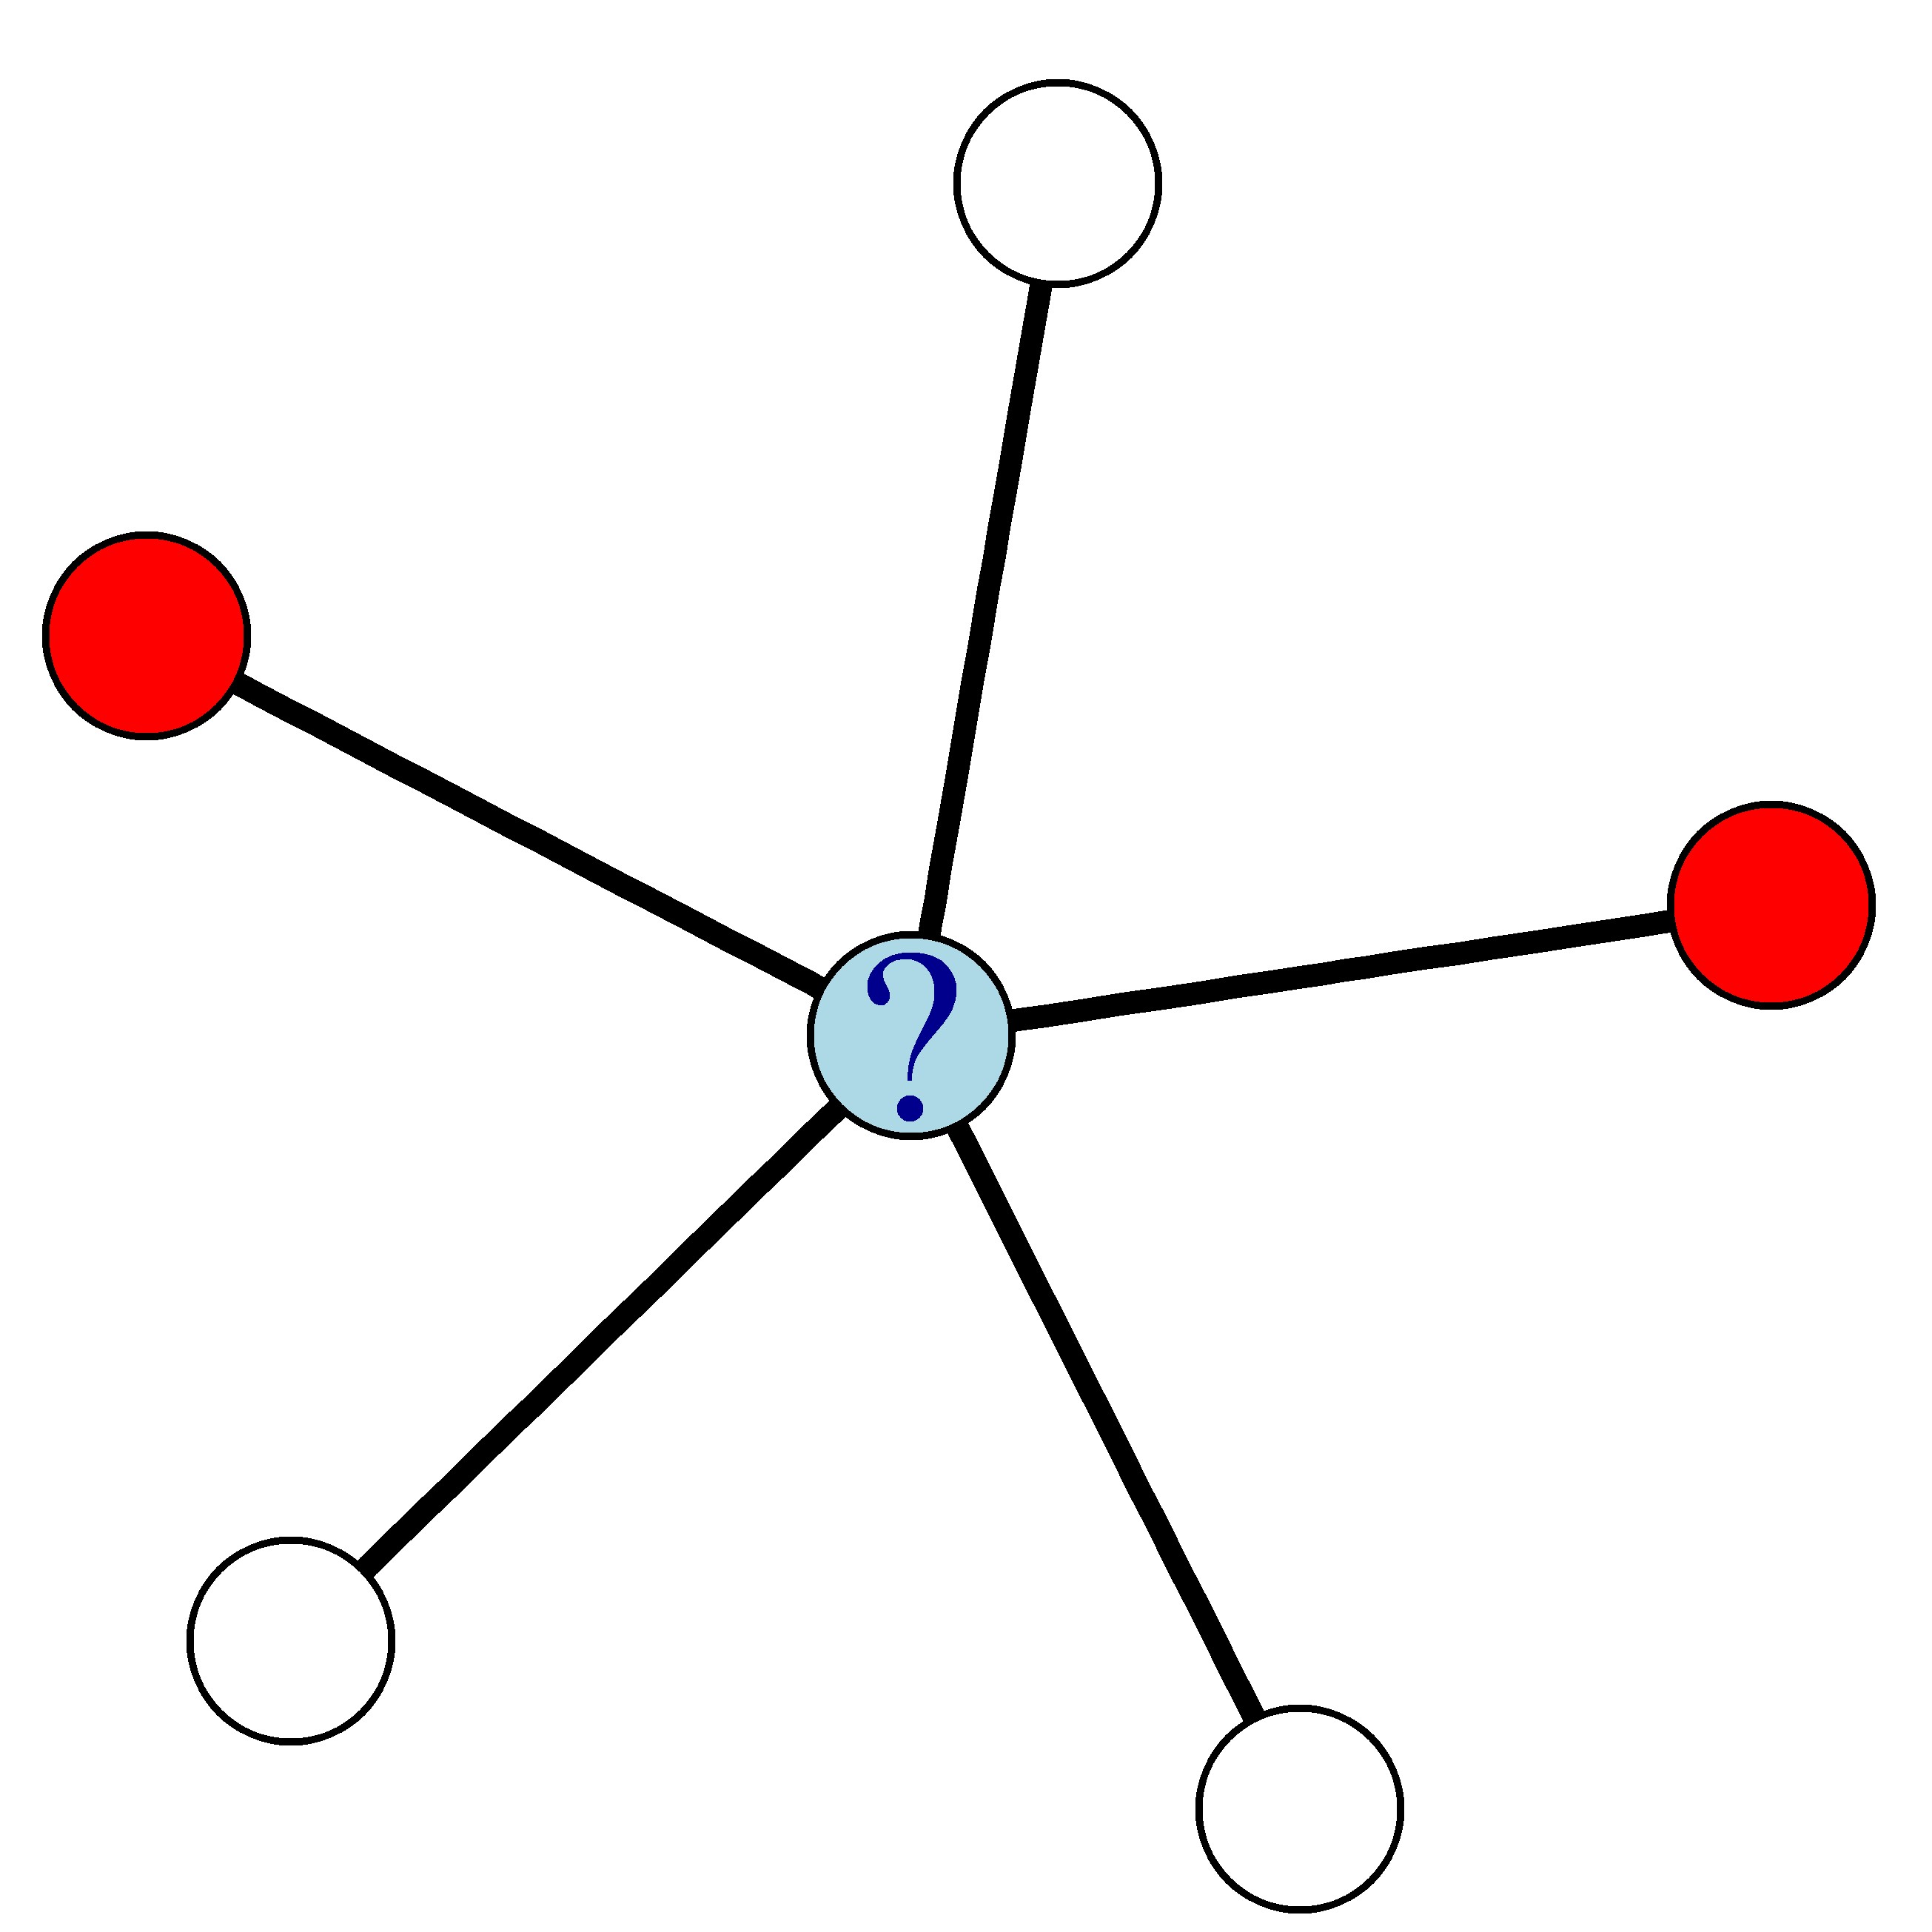
Il utilise les labels de classe des nœuds voisins pour calculer une probabilité de churn pour chaque nœud du réseau.
Par exemple, dans le réseau ci-dessous où les nœuds rouges représentent les clients partis et les nœuds blancs les clients restés, la probabilité de churn du nœud bleu est de 0,4.
Vous disposez de deux vecteurs : ChurnNeighbors et NonChurnNeighbors, indiquant respectivement pour chaque client le nombre de voisins qui ont churné et qui n’ont pas churné.
Cet exercice fait partie du cours
<cours>Analytique prédictive avec des données en réseau sous R</cours>Instructions de l’exercice
- Calculez la probabilité de churn de chaque client,
churnProb, à l’aide du classifieur des voisins relationnels. - Utilisez
which()pour trouver les clients ayant la probabilité de churn la plus élevée. Nommez ce vecteurmostLikelyChurners. - Utilisez
mostLikelyChurnerspour récupérer les identifiants des clients avec la probabilité de churn la plus élevée.
Exercice interactif pratique
Essayez cet exercice en complétant ce code d’exemple.
# Compute the churn probabilities
churnProb <- ___ / (ChurnNeighbors + ___)

# Find who is most likely to churn
mostLikelyChurners <- which(churnProb == ___(churnProb))

# Extract the IDs of the most likely churners
customers$id[___]