Interpretar un dendrograma
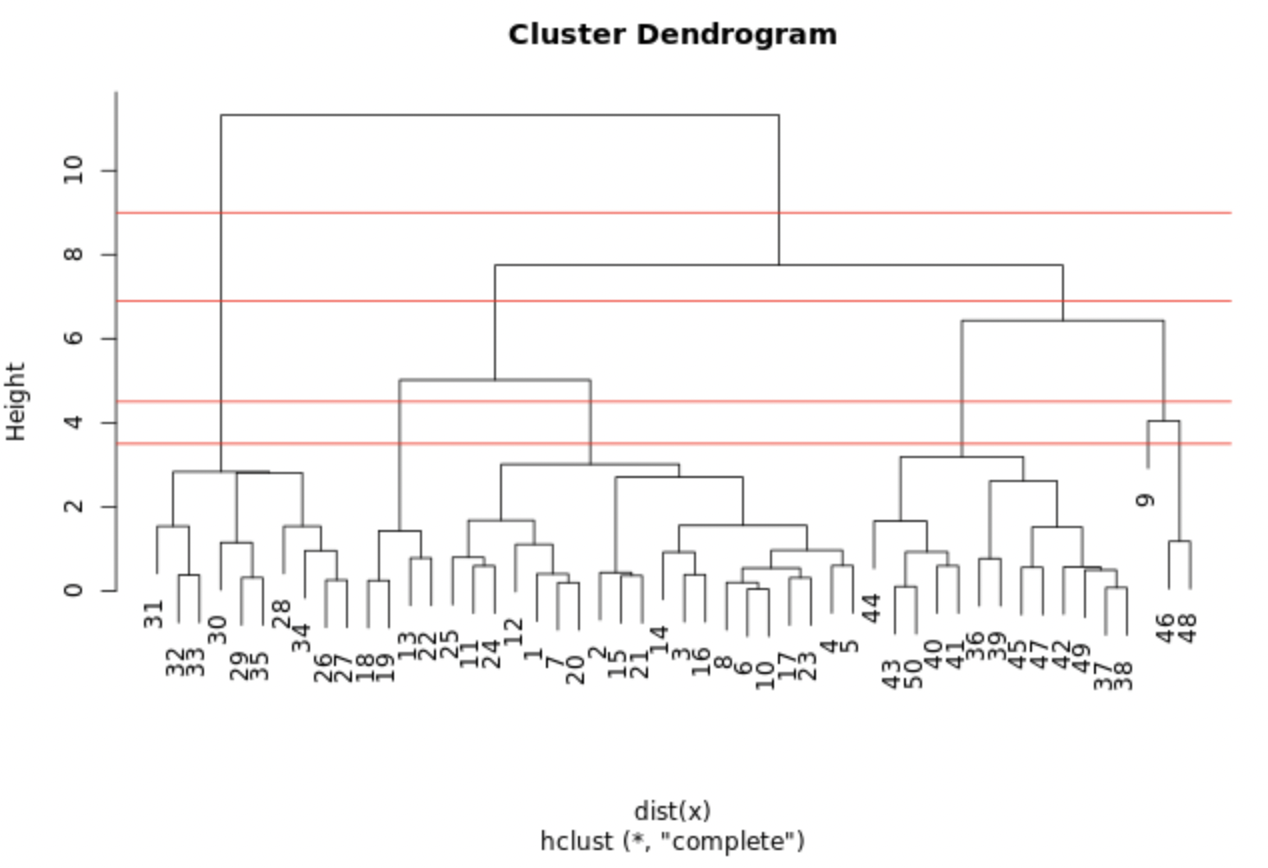
La gráfica muestra el modelo hclust.out que construiste en el ejercicio anterior. Hemos trazado líneas horizontales a las alturas de 3.5, 4.5, 6.9 y 9.0, respectivamente.
¿Qué punto de corte produce 3 clústeres?
Este ejercicio forma parte del curso
Unsupervised Learning in R
ejercicio interactivo práctico
Convierte la teoría en práctica con uno de nuestros ejercicios interactivos
 Empezar ejercicio