Interpretar gráficos de series temporales
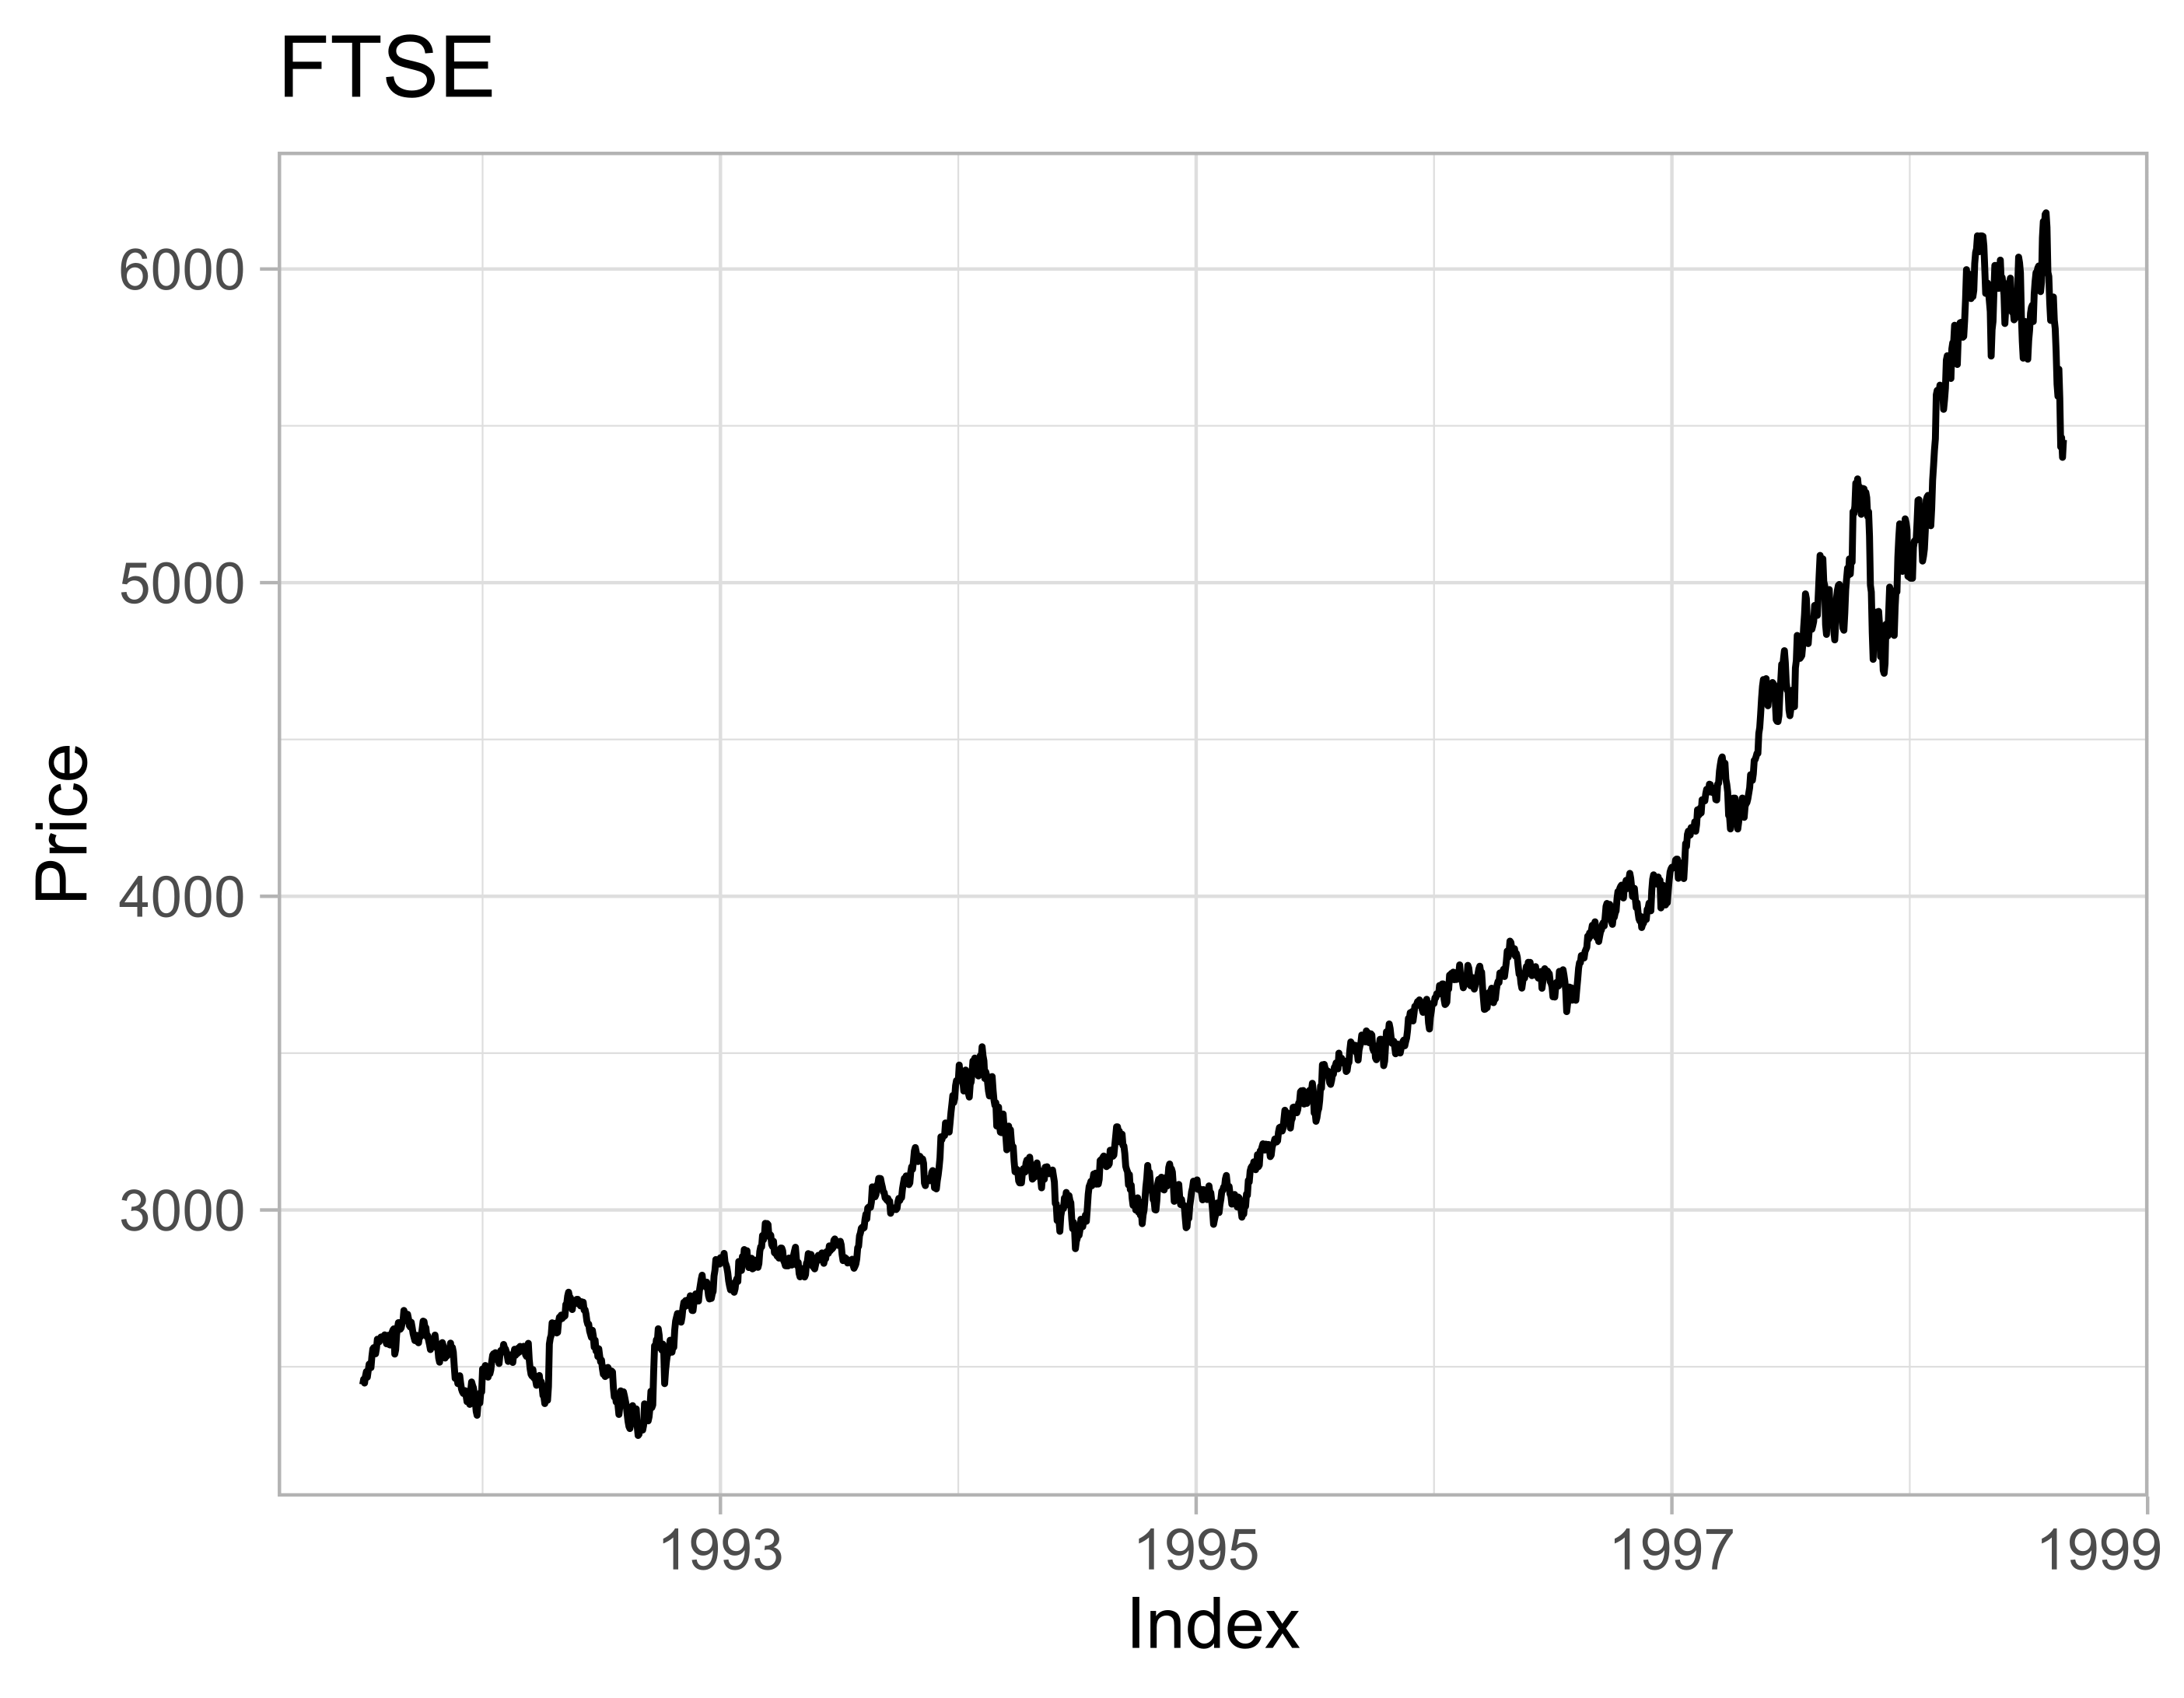
Al visualizar datos de series temporales, es fundamental saber interpretar las distintas características y atributos de los gráficos. Determinar las propiedades de tus datos a partir de un gráfico te permite preparar mejor las herramientas necesarias para el análisis. En este ejercicio, interpretarás algunas propiedades de la serie temporal ftse basándote en su gráfico.
Este ejercicio forma parte del curso
Manipular series temporales en R
ejercicio interactivo práctico
Convierte la teoría en práctica con uno de nuestros ejercicios interactivos
 Empezar ejercicio