Interpretación de los gráficos de insight de predictores
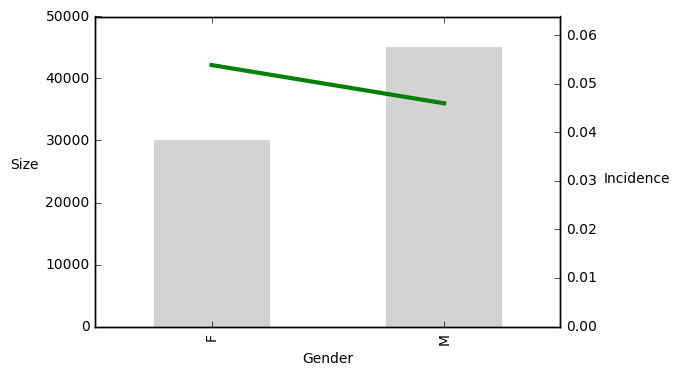
Considera el gráfico de insight de predictores que muestra la relación entre la incidencia del objetivo y el género (M - hombre, F - mujer) del posible donante. Las barras indican el tamaño de los grupos y la línea indica el porcentaje de objetivos.
Este ejercicio forma parte del curso
Introducción al análisis predictivo en Python
ejercicio interactivo práctico
Convierte la teoría en práctica con uno de nuestros ejercicios interactivos
 Empezar ejercicio